
We’ve discussed a few reasons to use Jupyter Notebooks as a GIS user. From visualization of your data to the recent integration with the ArcGIS platform, Jupyter Notebooks are quickly becoming a crucial component of GIS and data science workflows.
In spite of these benefits, coming up to speed and getting comfortable with Jupyter Notebooks can be a daunting task for a new user. There is nuance to the way Jupyter Notebooks operate that can take some time to comprehend.
If I’ve piqued your curiosity and you’ve taken the steps to install Jupyter Notebooks to help in your GIS workflows, the following tips may be helpful as your start exploring this tool.
1. Don’t Put Your Entire Code in a Single Cell

The most immediate difference between Jupyter Notebook and traditional Python Integrated Development Environments (IDEs) is that code is segmented into sections named cells.
My first recommendation is that you avoid the mistake I did on my first few notebooks: I entered my entire script into a single cell and treated Jupyter Notebook like a regular Python IDE.
Here’s an example where a script calculates a longitude and latitude for every record in a table:
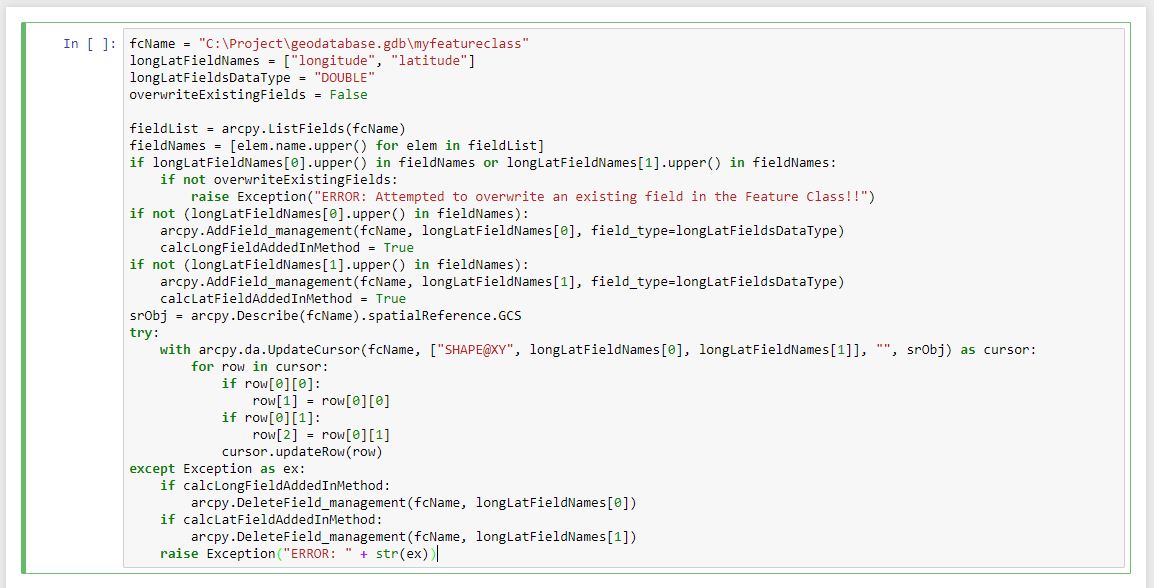
Doing this erodes many of the benefits that this tool provides!
Consider instead where your process contains logical breaks and create a cell for each component of your process. Not only is this more visually compelling and easier to understand but it allows you to test each step of your process independently without re-executing the entire script.
Here’s the same script from above, separated into individual code cells for each step of the process to calculate longitude and latitude:
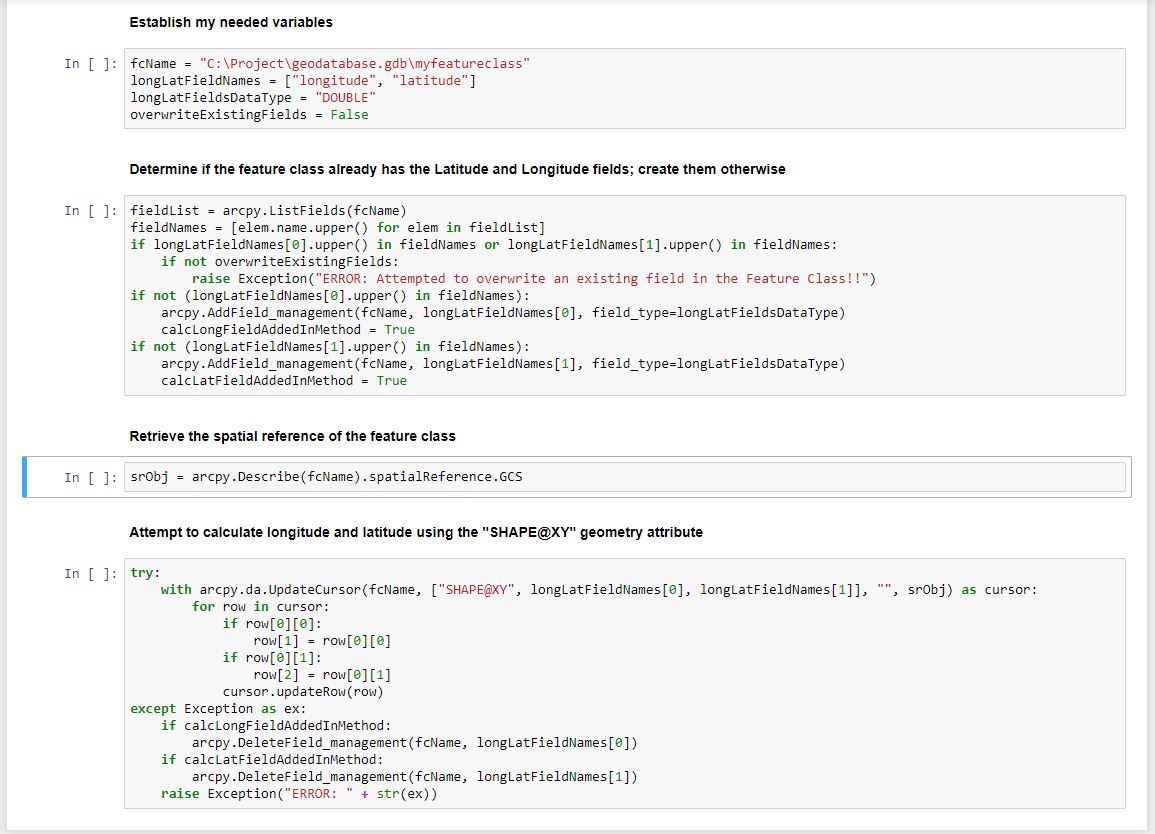
Splitting the script into cells allows you to test each component and ensure every step is acting in the way you expect. Additionally, you can document each component with a markdown cell, which takes me to the next tip…
2. There are different types of cells
In the example above, the comment lines above each item are a different type of cell; these are named “Markdown” cells.
Markdown cells are useful to help document your Notebook or to write detailed “readme” descriptions within your notebook.
All cells start as “Code” cells by default, but take a moment to explore the different types of cells available to you:
3. Executing Cells (shift + enter)
If you’ve taken steps to segment your code into separate cells, you may come across another mistake I did on my first notebooks: forgetting to execute all cells to run the entire process.
The following example highlights a common mistake I did in my first notebook:
Coming from using traditional Python IDEs where the code executes from start to end, I simply executed the cell that I finished writing, but forgot to execute the first cell which imports the ‘os’ module, triggering the error.
My advice:
Get used to pressing Shift + Enter when you are done writing a cell to execute it.
The Shift+Enter keyboard shortcut executes your cell and creates a new cell below to continue to your work. The smooth flow that it provides has resulted in this shortcut becoming my most frequently-used keyboard shortcut in the entire tool.
Here’s another stab at the simply workflow above using this method:
Another way to manually execute all cells in your notebook is the “Run All” command in the “Cell” tab of the toolbar:
4. Explore Interactive Mapping Options!
Did you notice the map in the example above? That’s the ArcGIS API for Python in action!
I briefly mentioned some of its benefits in the previous post, but let’s take a few steps to start exploring it.
The “Hello World” equivalent in the ArcGIS API for Python is the following:
The documentation does an excellent job of getting you started, but you can also explore some of its capabilities from within your notebook. This takes me to my final tip…
5. To explore new modules, use questions and TAB auto-complete
Most Python IDEs allow you to view code documentation and provide auto-complete functionality in some form.
Jupyter Notebook provides access to code documentation in an intuitive way: you can literally ask questions from your code to get answers about the functions and methods you can use. Use the “?” character following any Python object and code documentation is loaded into the active notebook.
Let me provide an example:
Please do keep in mind: the feature depends on the amount of documentation available in the code you are referencing, so not every module will provide you a detailed explanation of how it works. Even so, it doesn’t hurt to ask!
Using TAB auto-completion
Another interesting approach you can take to explore new modules or functions is to use Jupyter Notebook’s TAB auto-completion.
The way you use this is by entering the Python object, then a period, then TAB. All the available functions and methods are then shown in an interactive menu to let you explore and select the relevant one.
Here’s an example:
These are a few basic tips to help you hit the ground running as you start using Jupyter Notebook in your workflows.
If you’re attending this year’s Esri User Conference, my colleagues, Atma Mani and Rohit Singh will be presenting an introduction session on the ArcGIS API for Python and its integration with Jupyter Notebook.
Meanwhile, in this blog we’ll be gradually covering more advanced approaches to using this tool and exploring how it can integrate into a distributed GIS.
Stay tuned!

Article Discussion: