The Living Atlas Policy Maps team maintains a set of free layers that containing a wealth of data from the U.S. Census Bureau’s American Community Survey (ACS). In early December 2023, Census will release the newest ACS data for their 2018-2022 five-year estimates. Within days of that release, the Living Atlas Policy Maps team will refresh the ACS layers already available in Living Atlas with this new update from Census. Maps and apps that already use these layers will automatically display the most recent Census ACS data.
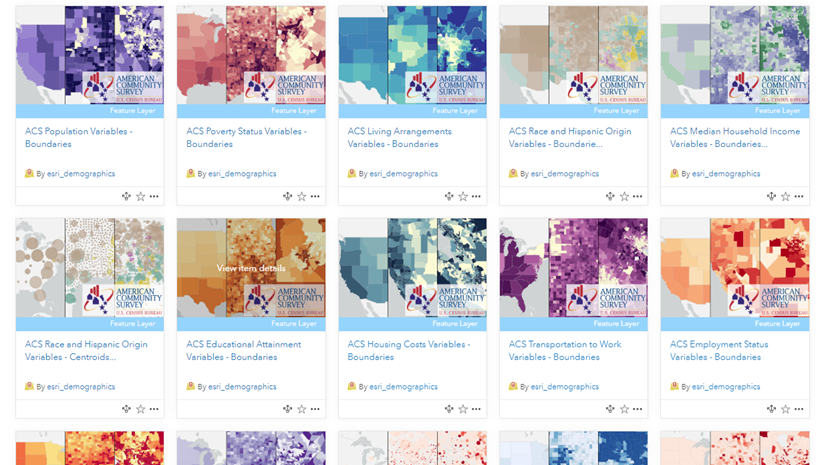
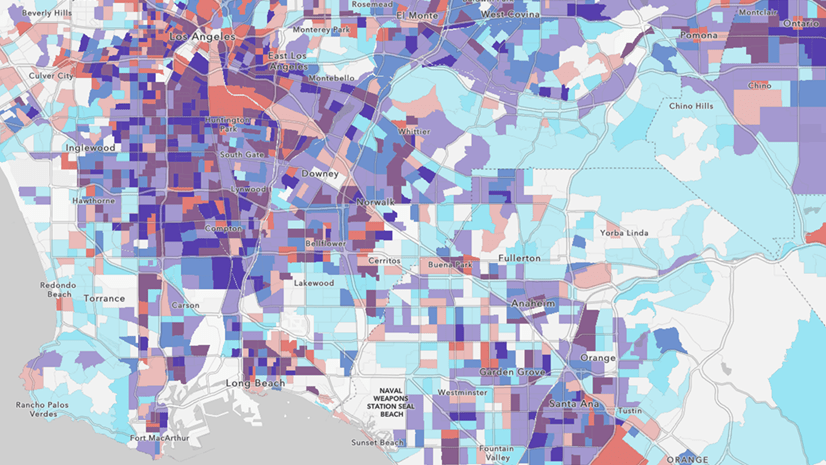
The Census ACS layers in Living Atlas cover a wide range of topics on population, income, education, health insurance, language, race and ethnicity, and more. These layers contain data for states, counties, and census tracts. More than 100 layers are available, each focusing on a specific topic. Each topic’s layer is hosted as both boundaries and centroids for your spatial analysis, mapping, charting and visualization. These layers are free to use and can be downloaded to your local drive as needed.
The data is made available in ArcGIS Online as hosted feature layers, only requiring an internet connection to use them. Through ArcGIS Living Atlas of the World, you can easily add these layers into your maps and analysis in ArcGIS Online and ArcGIS Pro. You can also use them within applications, Dashboards, ArcGIS StoryMaps, Insights, Business Analyst, and many other ArcGIS tools.
Layer Enhancements and Changes
Census Attribute Availability:
We added a layer called Specific Asian Groups a few years ago enable users to map groups such as Filipino, Korean, and Asian Indian. This year, Census is restructuring Table B02018 to include an additional five groups: Mien, Singaporean, Sikh, Kazakh, and Uzbek. The entire table is being restructured, therefore when you map groups/attributes that were available previously, their field name will change. We suggest reviewing and updating any maps using this layer to reflect the new fields.
Census Boundary Changes:
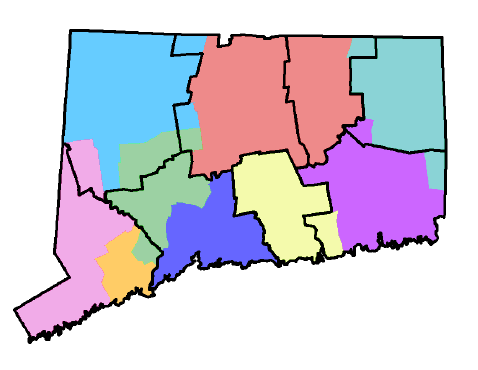
There is an additional geographic change for the state of Connecticut, rather than a data content change. Connecticut has worked with the Census Bureau to better align their counties to their own regional planning entities. This allows the state to better coordinate activities and services for their constituents. Connecticut counties (known locally as “planning regions”) are going from 8 to 9 total. All Connecticut counties and all tracts within these new counties will have a new FIPS code whose first five digits reflect the new county. For those of you who are familiar with Connecticut, your maps will look different. If you have any filters or queries on the FIPS or NAME fields, they will need to be updated with the new data. However, your maps using Living Atlas layers will have the most updated boundaries and data values.
Boundary Updates
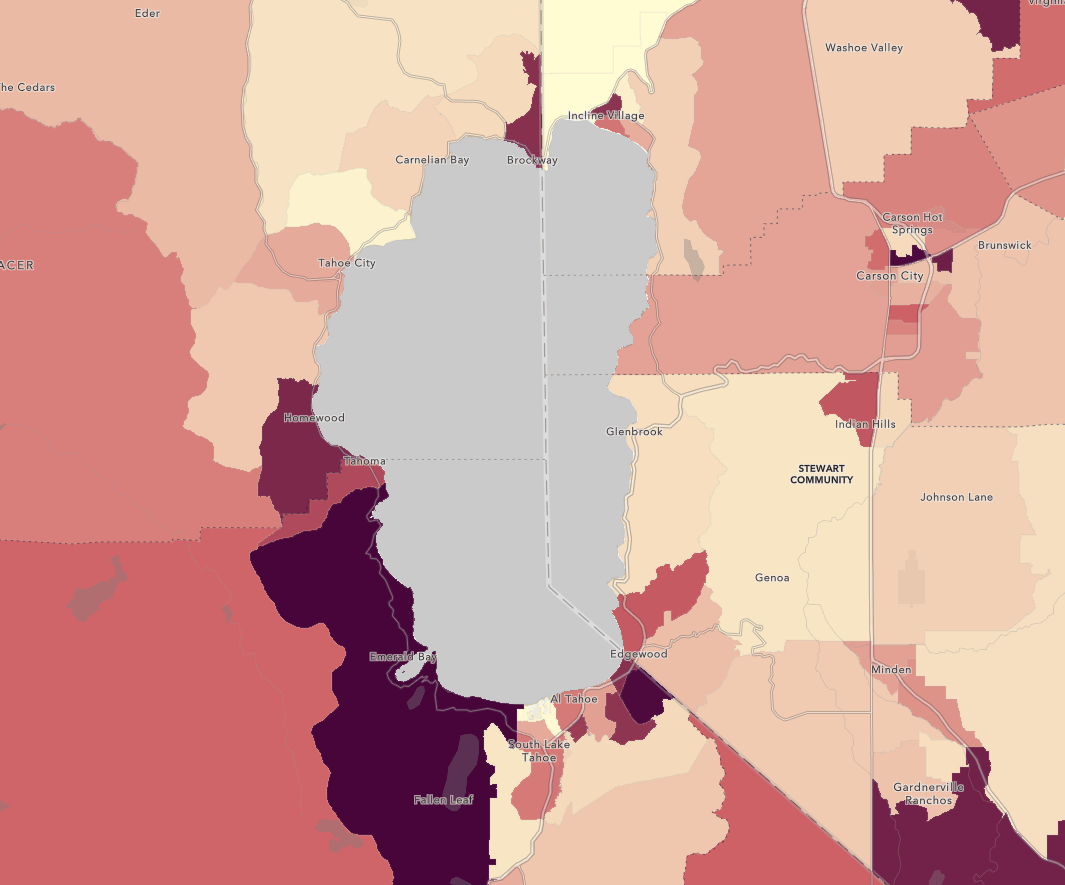
- The boundaries always reflect the TIGER boundaries that are appropriate for the newest ACS figures. In this update, the 2022 TIGER boundaries will be used in the layers.
- 2020 Areal Hydrography sourced from Census was used to shoreline polygons near the ocean, Great Lakes and selected other water bodies.
- State, county, and tract boundaries are shorelined where needed, with additional large or important water bodies cut out of the polygons. This supports map styles like dot density and map effects like drop shadow to work better.
Legend Updates
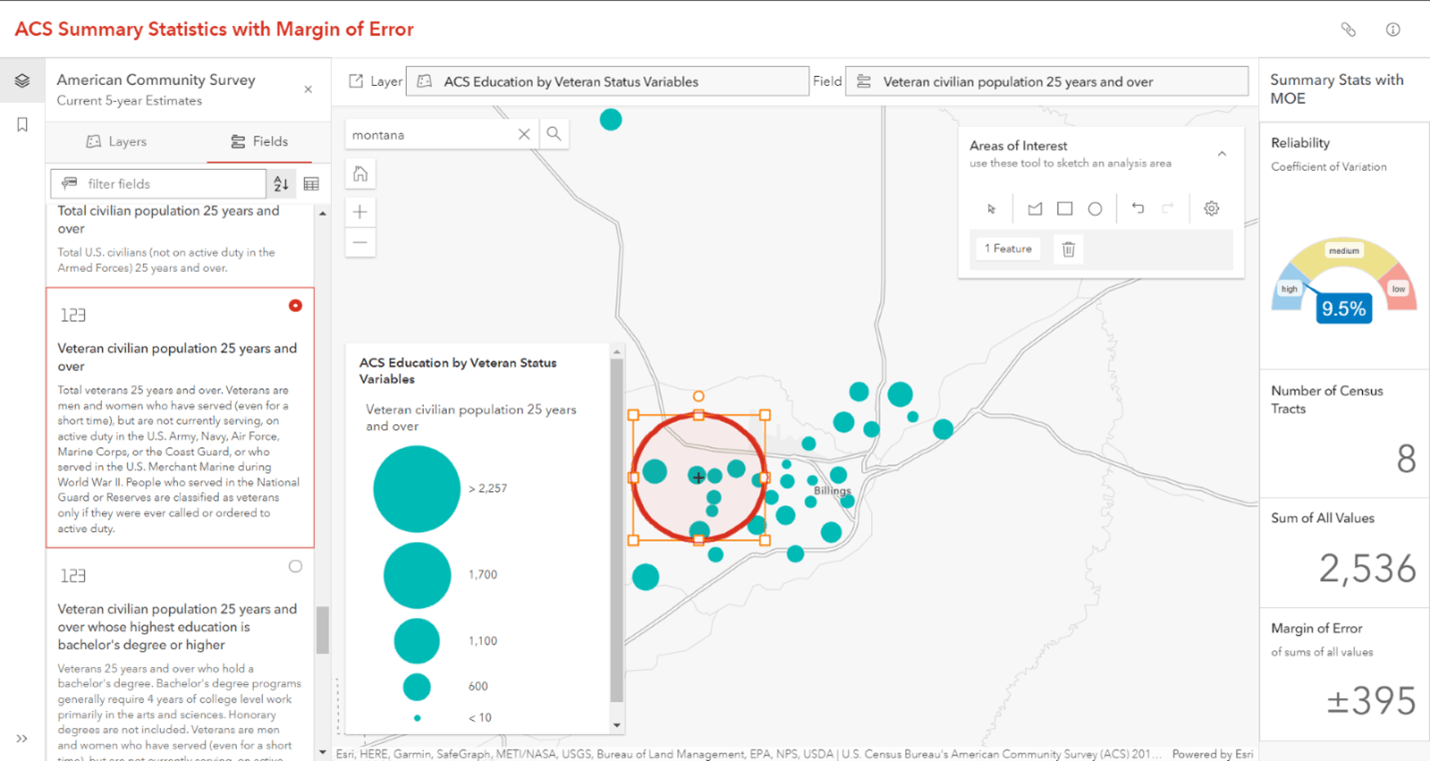
- Updated legends – many of the layers center their map symbols and colors around the national figure of the attribute being mapped to emphasize areas with higher or lower figures than the national figure. For example, the percentage of population with no health insurance coverage is currently shown as 9% in this layer’s legend. Once the update occurs in December 2023, a new figure will appear there based on the latest data. Both the center breakpoint with the new national figure and the top and bottom breakpoints are adjusted to reflect the latest values. The legends clearly state the updated national figures, helping create a reference point for the map reader. You can change it to use another significant value, such as the average for your state.
- The national value changes may be particularly noticeable for any currency values such as earnings, income, median contract rent, and median home value. See this blog on inflation to understand how your maps may be affected.
Using These Layers
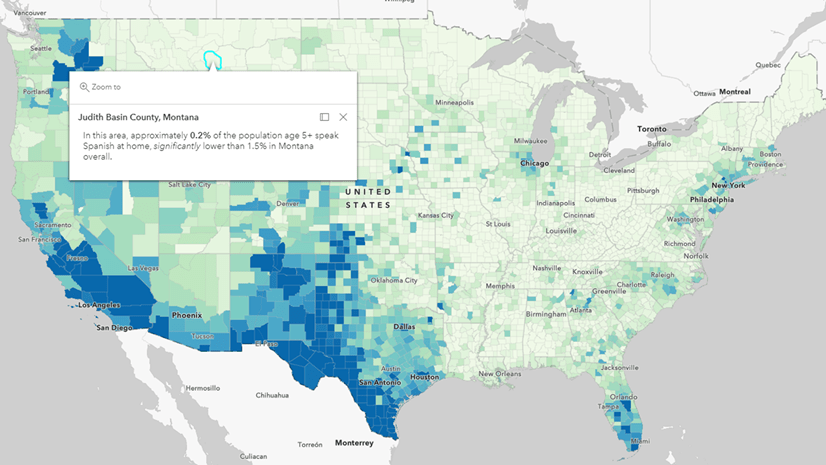
The American Community Survey (ACS) helps local officials, community leaders, and businesses understand the changes taking place in their communities. It is the premier government source for detailed population and housing information about our nation. The ACS layers in Living Atlas provide many of the popular variables directly within the ArcGIS platform. Being able to access these brand-new data values directly within Living Atlas makes it easy to start understanding the changes taking place in your community or areas of interest through maps and further analysis.
Find the layers in ArcGIS Online:
Learn where to find these layers and start using them within your mapping and analysis workflows. Check out this story map to learn how.
Get started:
Learn how to make a map about your community in four easy steps in this blog. You’ll have your own custom web map of your area in minutes!
Update your existing ACS maps:
When the new ACS figures are released by the Census and updated in Living Atlas, it’s time for you to check your web maps that use one of these ACS layers to see where you need to make updates to your map’s symbology and popups. If you are using an ACS layer from Living Atlas and have not modified it at all, then you will appreciate knowing that your layer has been updated, with new data, updated symbology, and updated popups.
If you are using an ACS layer from Living Atlas and have modified its symbology, popups, etc., you’ll appreciate that the data has been updated, but your symbology and popups kept your modifications. To confirm, check out the layer properties in Map Viewer to see what properties are stored in the source layer or stored in the web map. The attribute data in the latest five-year ACS layers changes each December and is automatically reflected in existing maps. After this release, verify that your map’s symbology breakpoints and popups still make sense with the updated data.
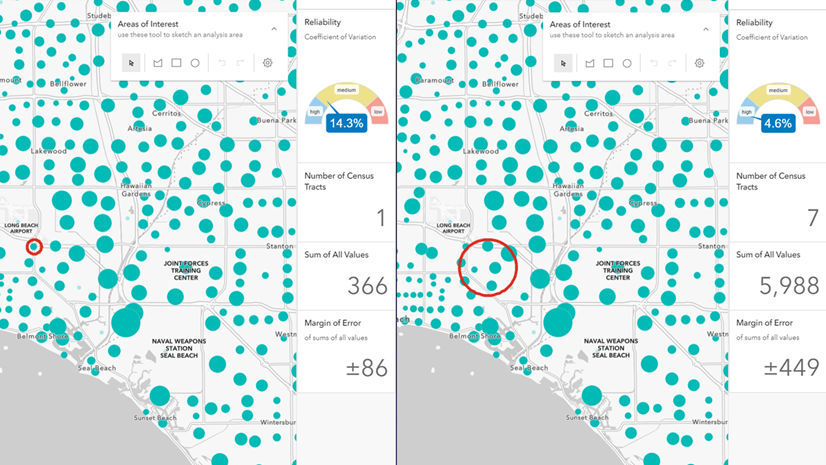
Understand and use Margins of Error:
This lightweight app is designed to help you get a quick sense of how you can aggregate up geographically to make data more reliable and how many tracts are needed to get an estimate that meets your desired reliability. Check out this blog to learn more.
Business Analyst and GeoEnrichment:
Developers can access the latest available ACS Data through Esri’s GeoEnrichment Service, while Business Analyst users can access in the Business Analyst web app. Esri will release new ACS 2018-2022 data through GeoEnrichment Service and Business Analyst next year, typically around March or June. To learn how to use the current ArcGIS Living Atlas data in Business Analyst, please see the step-by-step guided blog or check out this guided tutorial video.
Questions?
If you have questions about the layers, visit our FAQ, or post on Esri Community’s Living Atlas space. You can also learn more about the layers in this blog.


Article Discussion: