The Importance of Measuring Dependency
Are non-workers outnumbering workers? How many employed individuals are there to support the child and senior populations in my area? These questions and more are critical to gaining a complete understanding of the current economic landscape in any study area. Having simple measures to answer questions of dependency can help quickly fill in knowledge gaps that could determine how support services are allocated, where new business ventures are established, or many other use cases.
Other measures of dependency, such as the Age Dependency Ratio (ADR), provide useful information to aid analysts and decision-makers but do not incorporate data on the labor force dynamics unique to each area. New for 2021, Esri’s Economic Dependency Ratios can help you obtain a more detailed picture of dependency.
Esri’s Economic Dependency Ratio
The Economic Dependency Ratio (EDR) is a measure of an area’s non-workers (the child, unemployed, and not in the labor force populations) relative to the total employed population.

As this formula shows, both age and labor force information are included to provide an accurate picture of the number of non-workers for every 100 workers. The US EDR for 2021 sits at 110.2, or about 110 dependents per 100 workers. This ratio can be further disaggregated by age group into the Child Economic Dependency Ratio (CEDR), Working-Age Economic Dependency Ratio (WEDR), and Senior Economic Dependency Ratio (SEDR).
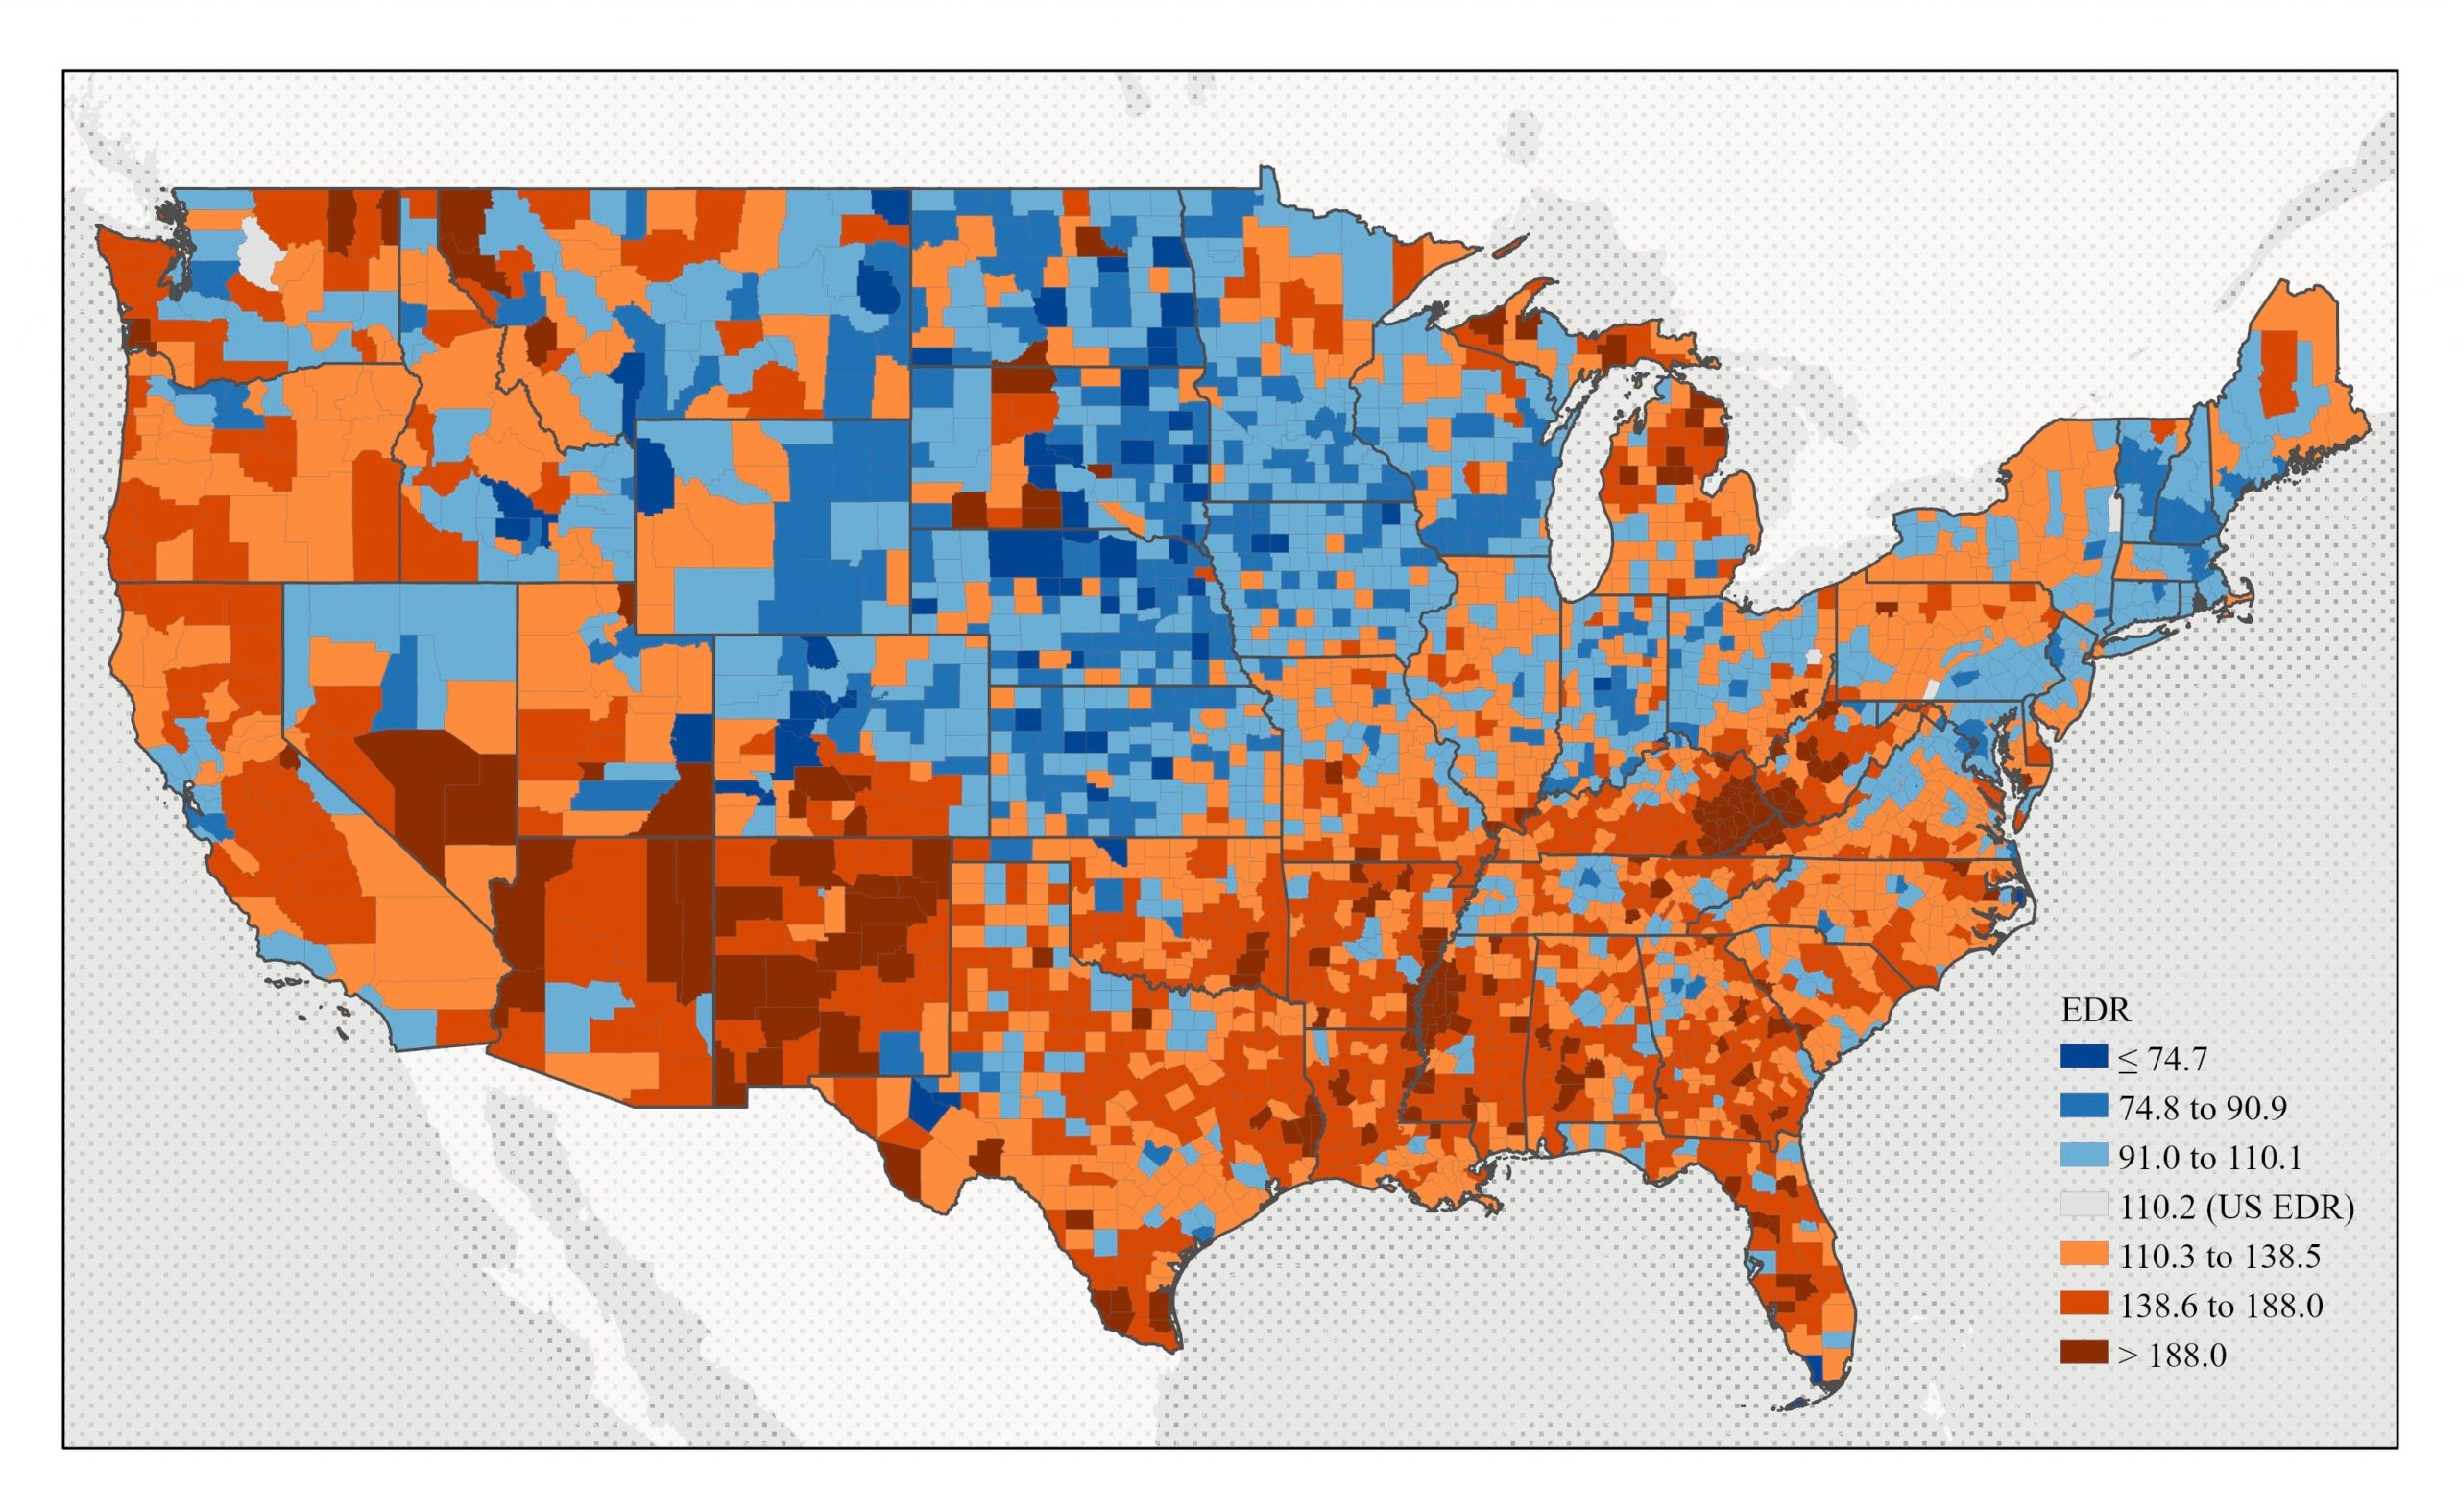
The map below displays the EDR by county in the contiguous US. Darker blue areas represent lower EDRs, while darker orange areas represent higher EDRs when indexed to the US EDR value of 110.2.

For more information about the EDR calculations and potential use cases view the related Technical Document and Learn Lesson.
How does the Eonomic Dependency Ratio compare to the Age Dependency Ratio?
In contrast to the EDR details above, the ADR formula is:

As this shows, one key difference between these measures is that the EDR incorporates information from Esri’s labor force database. This means that the EDR calculation can potentially include portions of the working-age group in the dependent population if some of this population is not employed or segments of the senior group in the non-dependent population if they participate in the labor force at age 65 or older. Like Esri’s other labor force data, the EDR is a civilian-only measure that does not factor in the prison and Armed Forces populations. Another important distinction is that the cutoff between the child and working-age groups is age 16 for the EDR compared to age 18 for the ADR due to the disparity between the standard definition of children and the basic minimum age for employment in the US. As a final difference, the EDR is available for only the current year whereas the ADR is released for both the current and forecast years.
The US ADR for 2021 is 64.0, or 64 dependents per 100 individuals aged 18 to 64. Similar to the EDR, the ADR can be calculated by age group to produce the Child Dependency Ratio (CDR) and Senior Dependency Ratio (SDR).
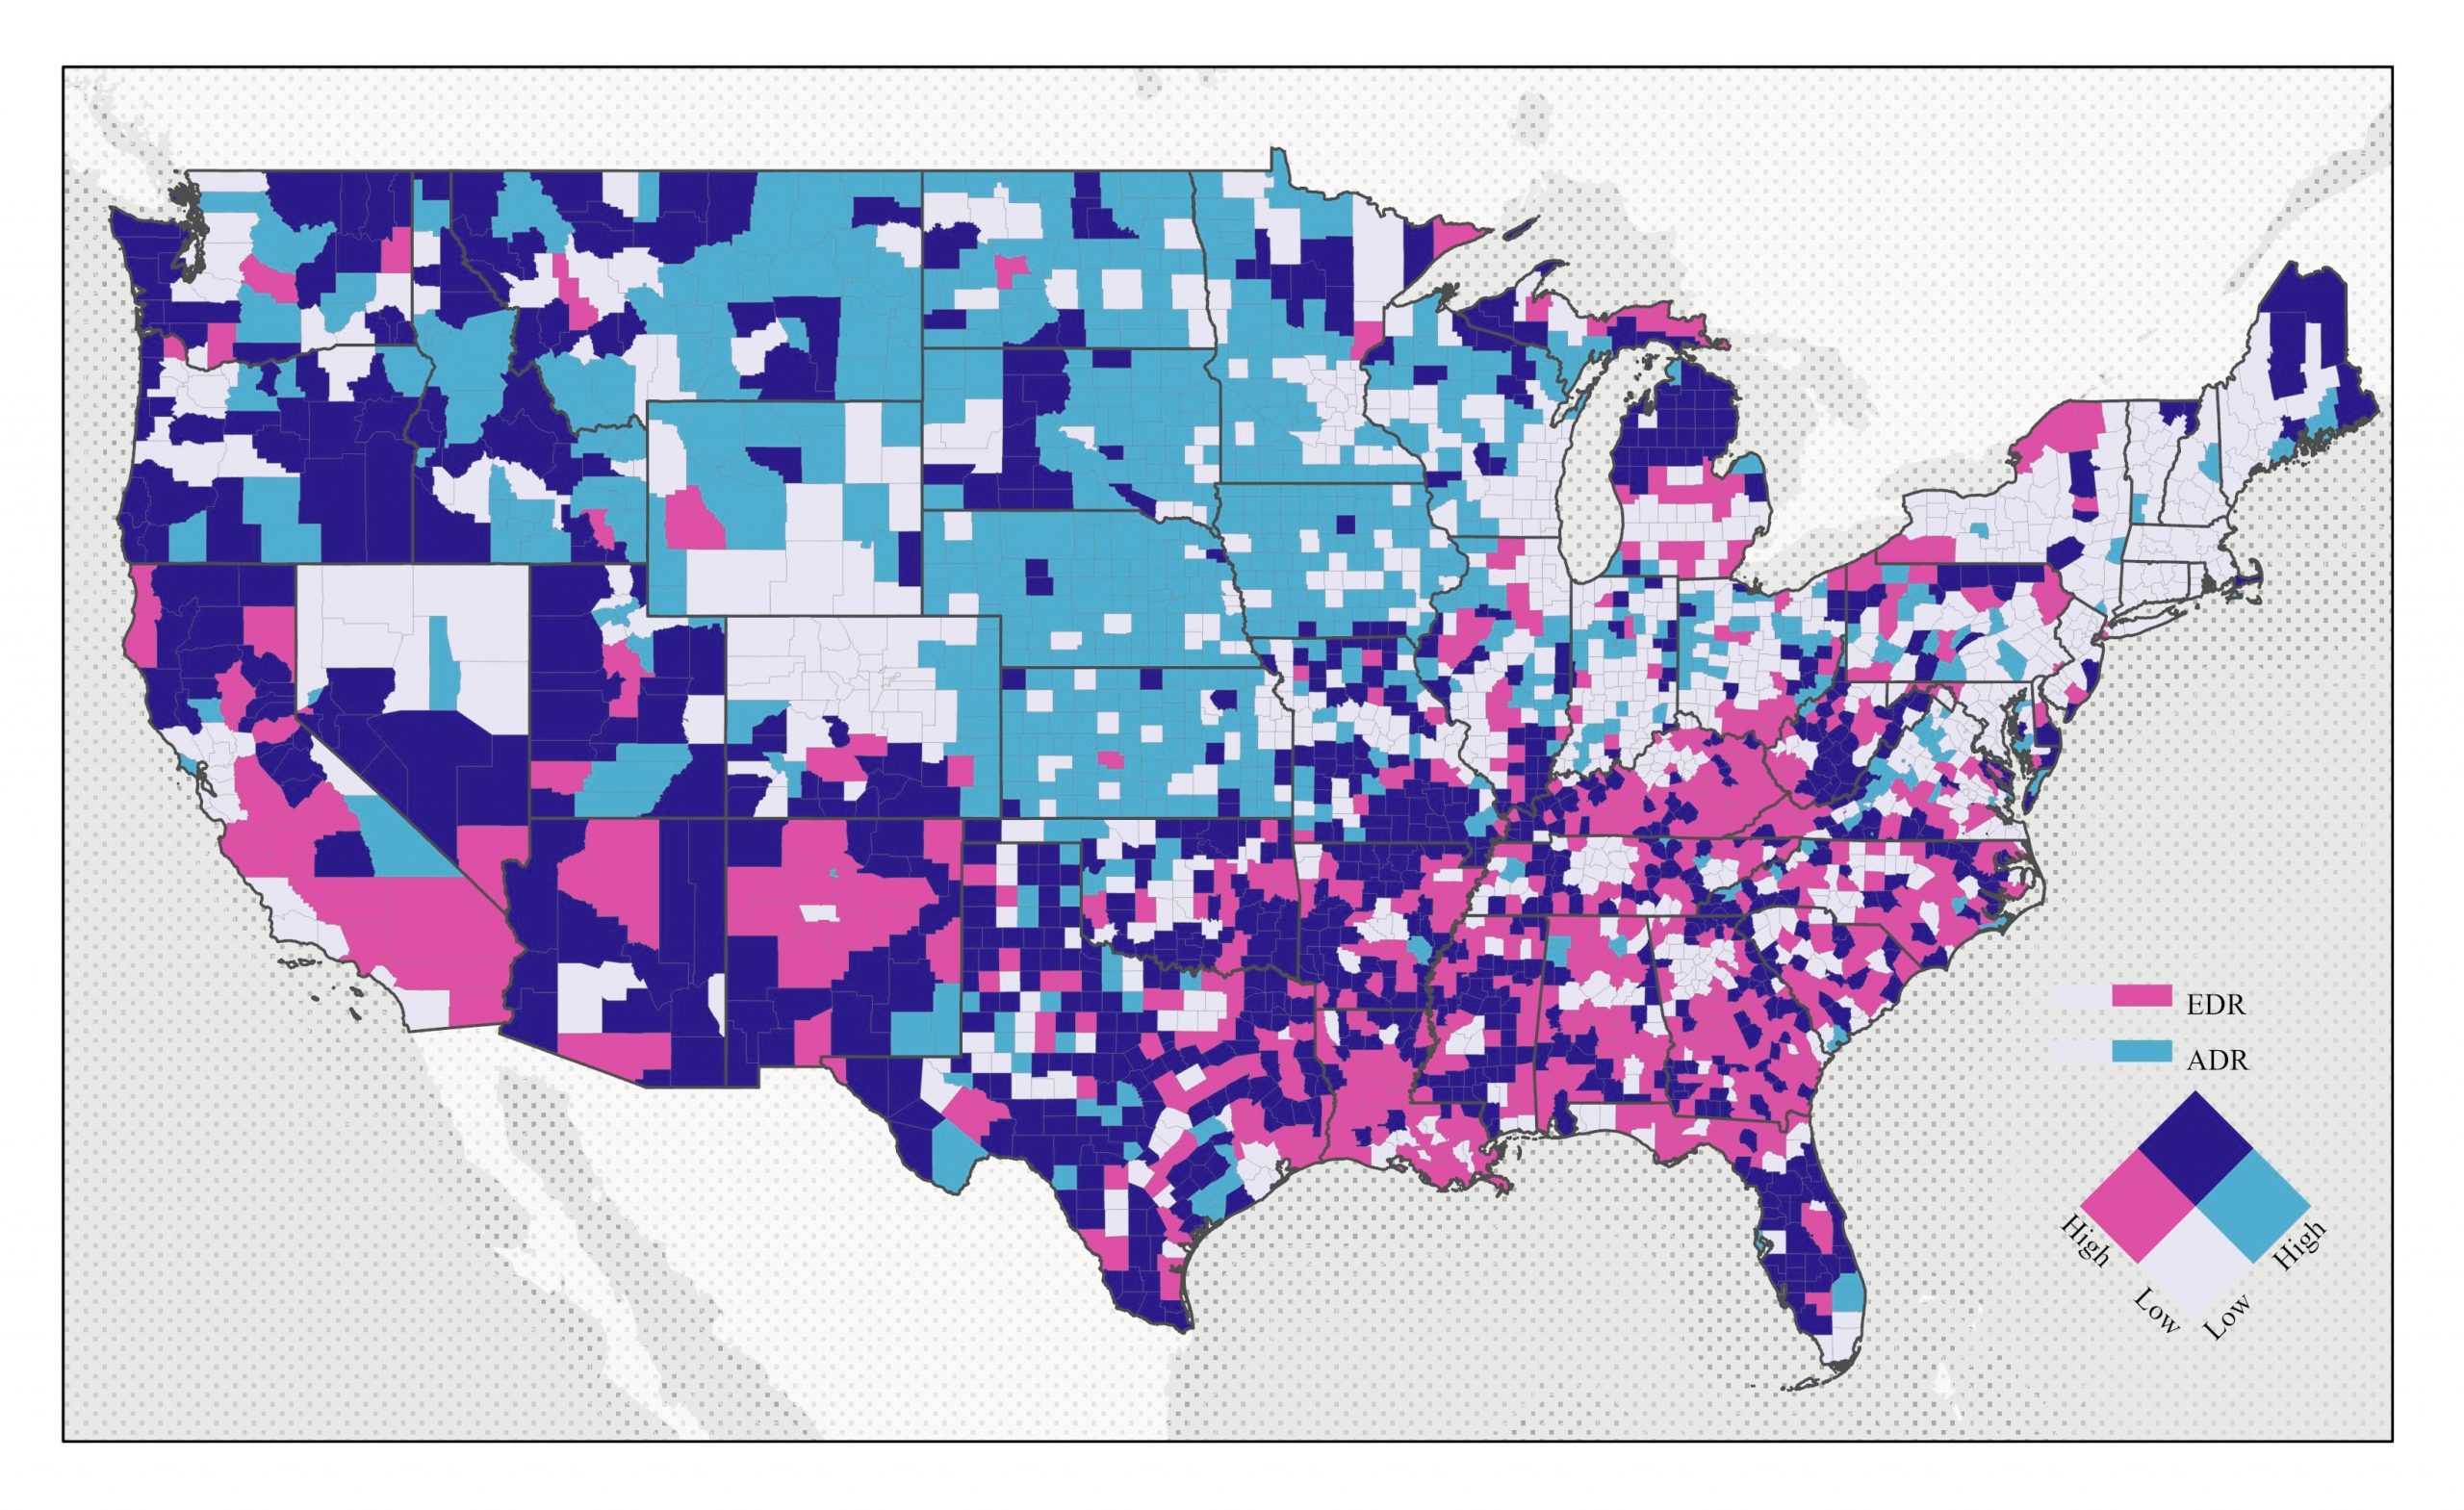
The relationship map below offers a visual comparison of the EDR and ADR at the county level. Some clear trends emerge when looking at the US regions, such as high ADRs and low EDRs in much of the Midwest and low values for both ratios in segments of the Northeast.

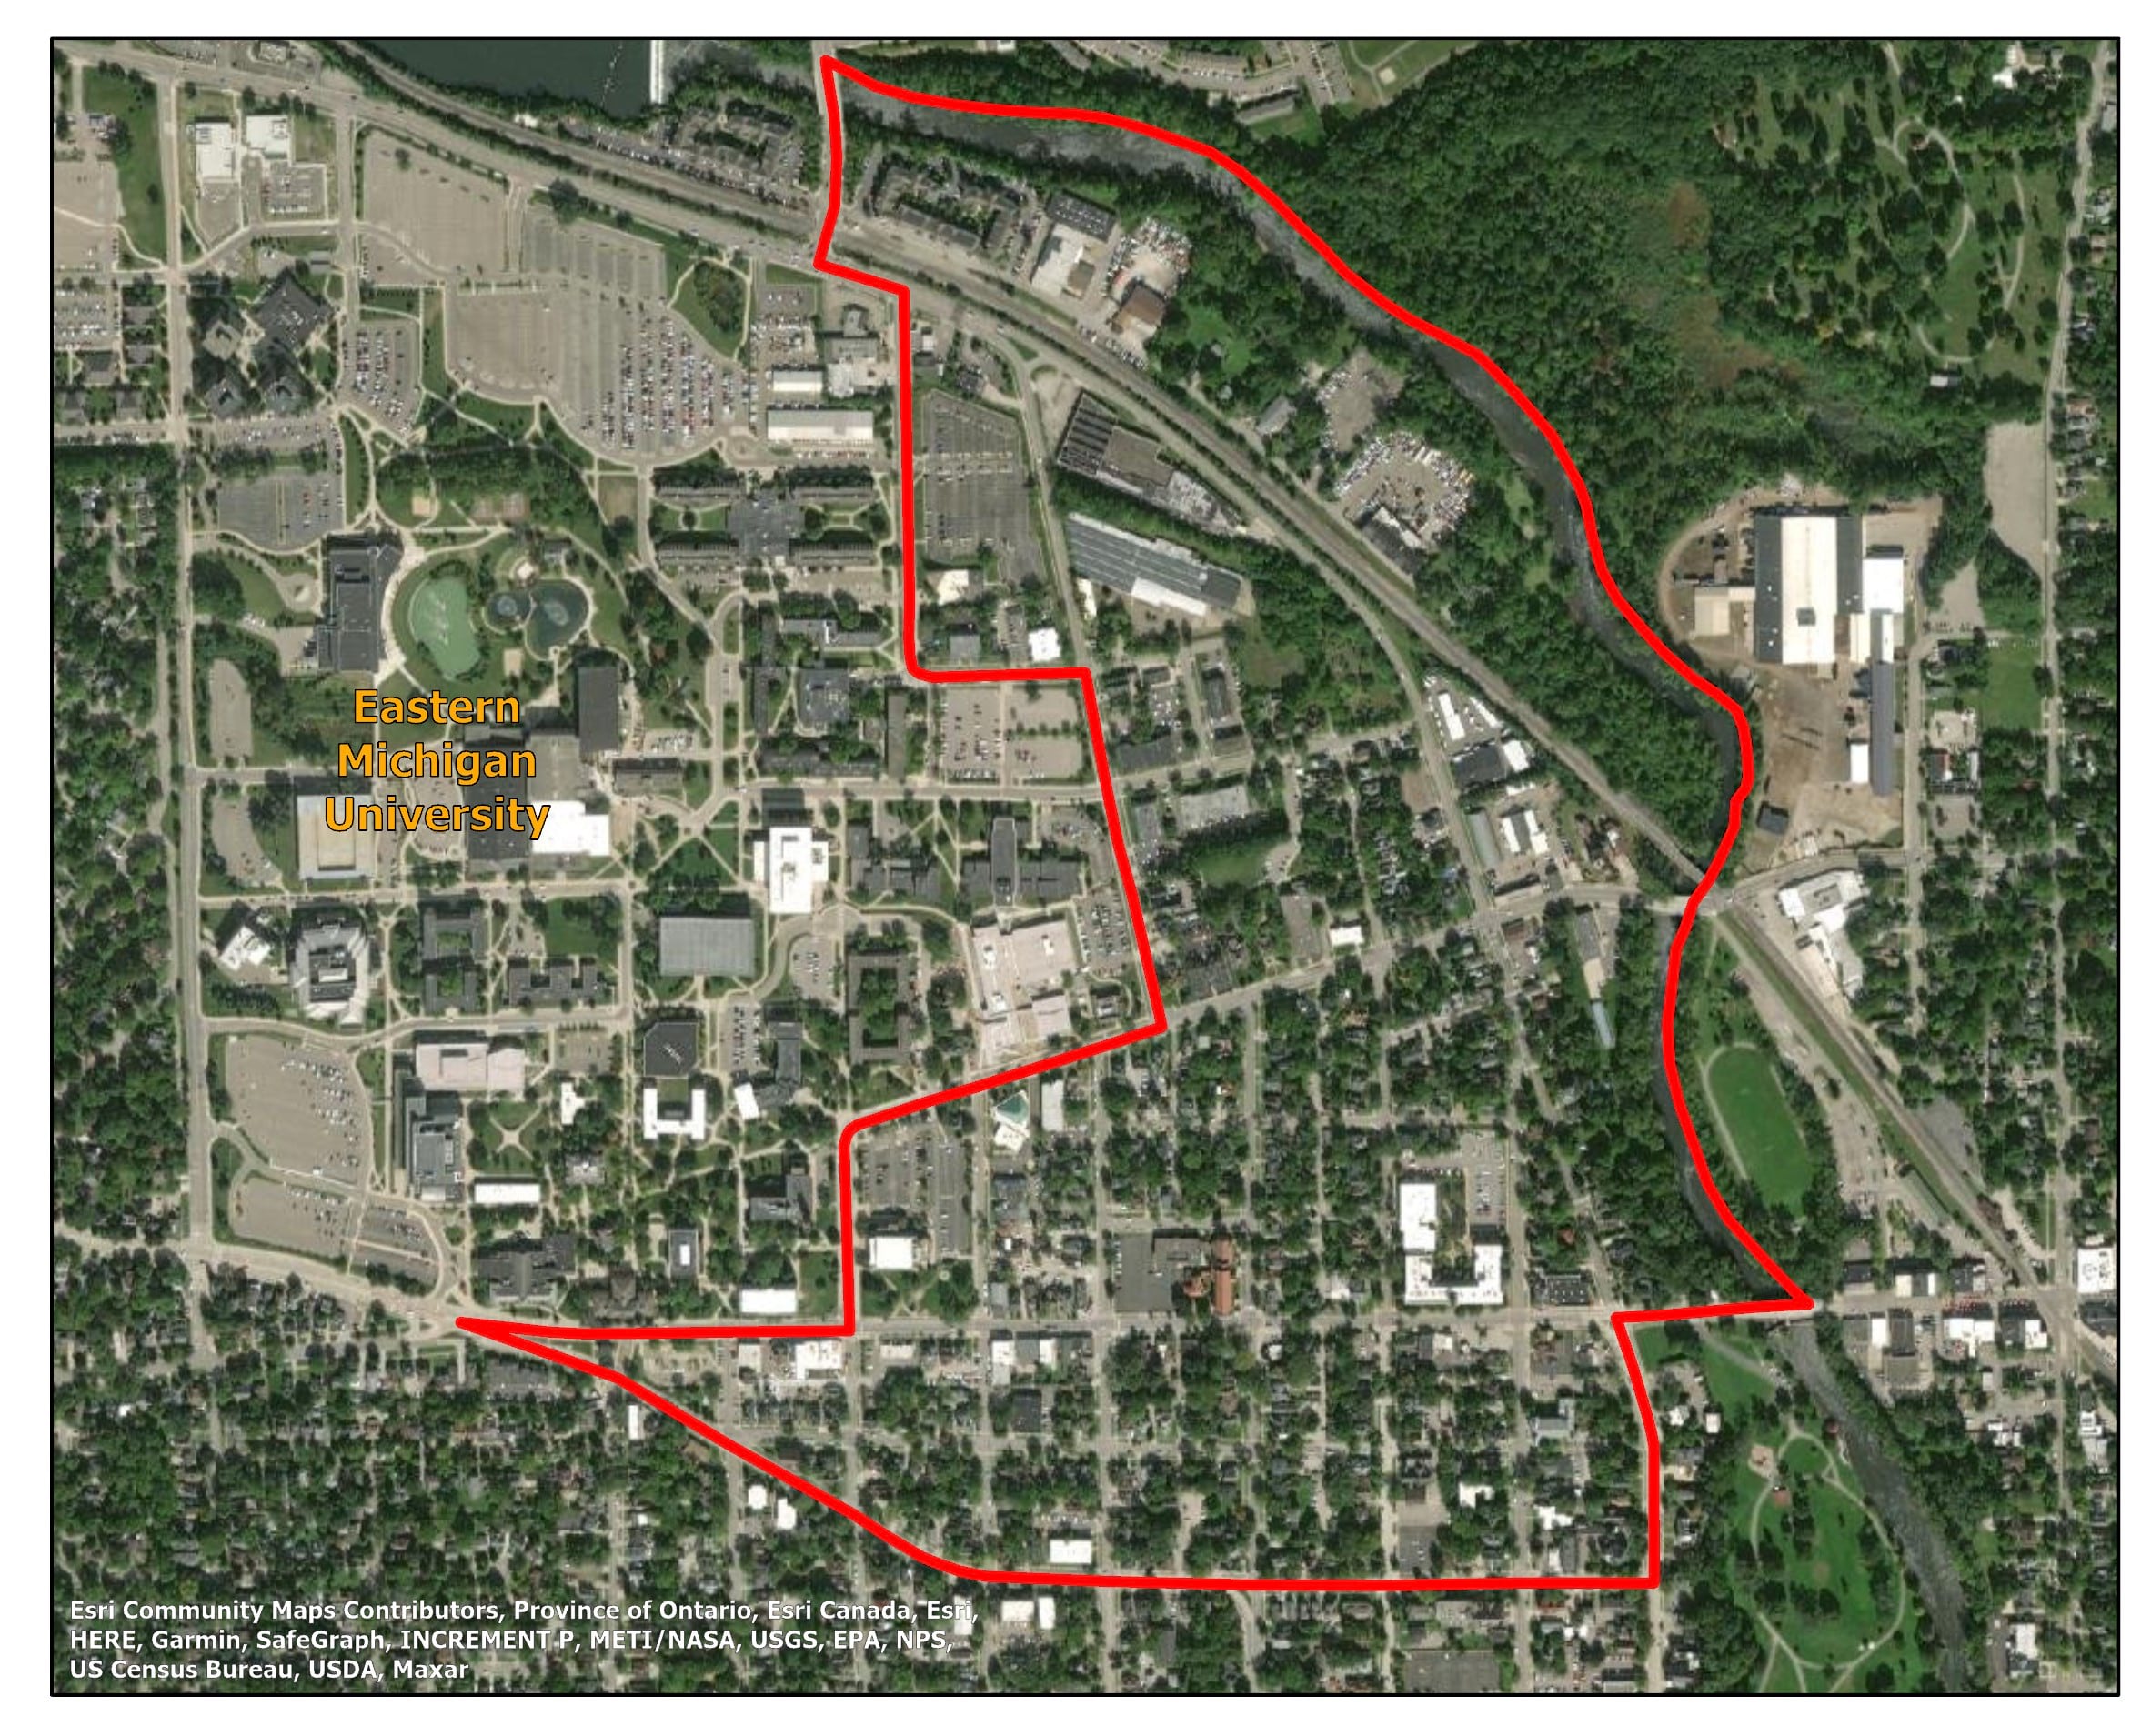
Let’s look at a specific example that further highlights the key differences between these ratios. The image below displays the 2010 TIGER geographic boundaries for Census Tract 26161411000, which falls right next to Eastern Michigan University in Ypsilanti, Michigan. As you would expect, in addition to the demographic mix typical to this area, this tract contains a large proportion of college-aged individuals in the 14B: College Towns and 14C: Dorms to Diplomas Tapestry segments.

In the ADR calculations, this group of young adults is placed into the denominator as they are included in the working-age population aged 18 to 64. This results in an ADR of 13.6 (i.e., approximately 14 dependents for every 100 individuals aged 18 to 64) in this tract. However, due to the relatively low rates of labor force participation common to this demographic group, many of these college-aged individuals are placed into the numerator of the EDR calculations. The EDR for this tract is 41 (i.e., 41 non-workers for every 100 workers), approximately three times the size of the ADR.
As this example illustrates, factoring labor force data into the dependency framework can significantly alter the results. The ADR gives a quick read on the age structure of an area, whereas the EDR provides a more robust measure of both age and labor force participation. Including both Age Dependency Ratios and Economic Dependency Ratios into your analysis of an area can provide a more complete picture of its unique makeup.
Accessing the Data
Available for all geographic levels for Esri’s 2021 demographic release, the new dependency ratios are a complement to other Esri Demographics such as the civilian labor force database.
To purchase Esri’s Economic Dependency Ratio (EDR) data set, please contact our data sales team at: demographics@esri.com or call our toll-free number at: 1-800-292-2224.
For more information about U.S. demographics click here.

Commenting is not enabled for this article.