By Aileen Buckley, Mapping Center Lead
The key to using a picture fill symbol when imparting realism is to choose one that has a random appearance. Another trick is to pick one that looks something like the type of feature you are mapping. A number of pictures are provided with ArcGIS, and many of them fit these criteria. Follow the steps below to see how you can apply this symbology on your maps using pictures provided by Esri.
- In ArcMap, right click the polygon layer and click Properties.
- On the Symbology tab, use either the Features or the Categories > Unique Values renderer depending on whether you are symbolizing a single type of feature or a variety of features.
- Double-click the symbol patch and click Edit Symbol.
- Change Type to Picture Fill Symbol and click the Picture button.
- Navigate to the location of the picture files—usually, this is C:Program Files (x86)ArcGISDesktop10.0StylesPictures.
- Browse the pictures to find one that has a random appearance and mimics to some extent the real-world appearance of the type of feature you are symbolizing. For example, to symbolize dry lakes, you could choose a “sand” picture file (figure 1).
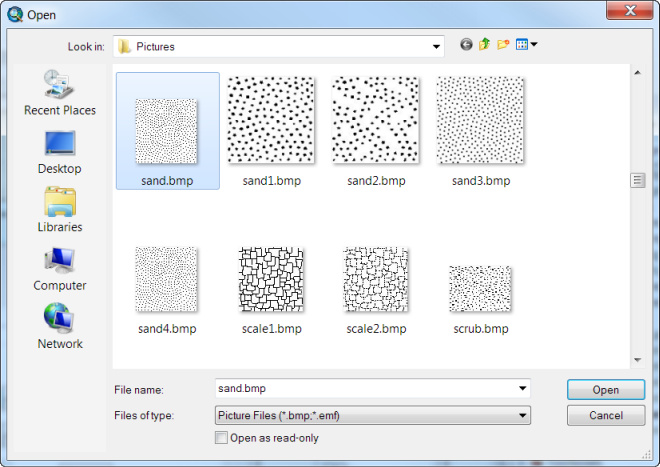
Figure 1. A number of picture files have a random appearance and have been created to mimic real-world features.
- Change the foreground color to a color that mimics what you are mapping. We choose a brown color (Burnt Umber) to symbolize dry lakes.
- Set the background color to No Color so that the variation in the background can still be seen within the polygon area. For example, if you are using a hillshade with an elevation tint, the background will appear uninterrupted, giving the polygon feature a more realistic appearance. This is the same idea as using a gradient to add variation to the fill.
- Experiment with the Scale X and Scale Y values to find something that looks realistic on your map—I generally I find that I need to decrease these values a bit.
- If desired, you can add a second layer to the symbol and use the graduated fill described in the sun glints blog entry to add a background color to the symbol (figure 2).
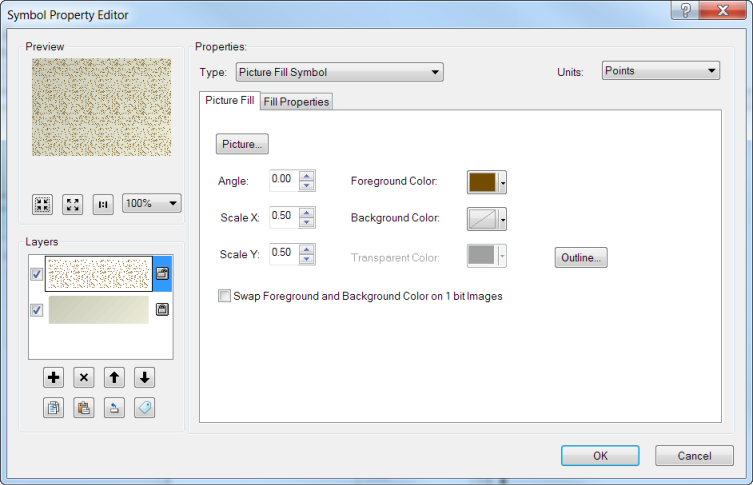
Figure 2. A second layer can be added to the symbol to provide a gradient fill as the background.
In this example, we used a gradient fill that varied from the same brown as in the elevation-tinted hillshade to a slightly darker version of that (figure 3).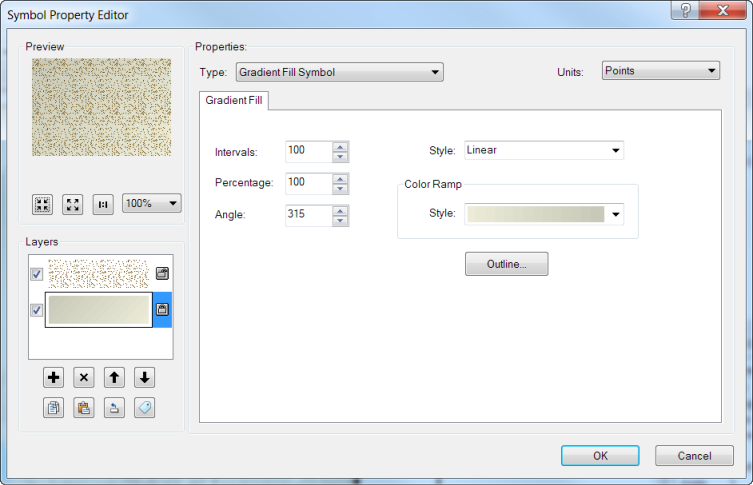
Figure 3. The gradient fill used for the background of the dry lakes symbol
NOTE: To determine the color of the background, use the Eye Dropper tool. (You can use the Eye Dropper tool to identify the RGB values of any color on your map and save the color to your personal style. From the Customize menu in ArcMap, choose Customize Mode to open the Customize dialog box. Click the Commands tab and navigate to the Page Layout category. Drag the Eye Dropper tool
 onto any toolbar.)
NOTE: To create a darker version of the background brown, use the HSV color model and set the Value to a lower number.
- Click OK > OK > Apply to see your changes.
- Make any modifications you think might help, and click OK to save all your changes.
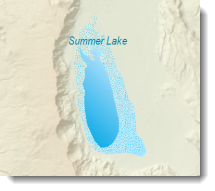
To make the intermittent lake symbol, you can use the same steps outlined above, but change the foreground color of the picture fill symbol to blue (RGB 0 197 255), the dark brown in the gradient fill to a light blue (RGB 176 233 255), and the angle of the gradient fill to 355 (figure 3).
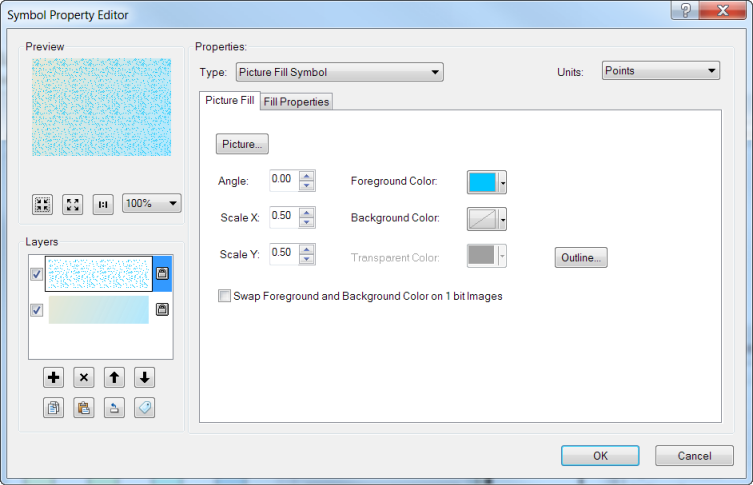
Figure 4. The picture fill symbol for the intermittent lakes
The final result imparts a feeling of professionalism and realism that your readers will appreciate.
Thanks to David Barnes, Cartographic Product Engineer, for his Crater Lake area map.

Article Discussion: