(First published March 10, 2022; most recent update: July 15, 2025)
You can use ArcGIS for Power BI to add detailed data-driven map visualizations with spatial analysis to your Microsoft Power BI reports with demographic data enrichment.
ArcGIS for Power BI is an embedded, out-of-the-box map visualization in Microsoft Power BI. A component in the ArcGIS for Microsoft Fabric product suite, it adds location and spatial analysis to your Power BI reports.
What is demographic data enrichment?
Demographic data is (essentially) population statistics that can be used to enrich your report’s metrics. Choosing the right demographic data helps you add context to your ArcGIS for Power BI map visualization by illustrating critical information about the population surrounding your location data.
Esri partners with data aggregators and providers like the U.S. Census Bureau to build upon your spatial analysis with curated, global population details. You can enrich your reports with census details about income, age, and households; consumer spending habits; business summaries; crime statistics; traffic information; and much more.
By combining Esri demographic data with ArcGIS for Power BI, you can enhance your reports with the following:
- Add reference layers to your map that provide insight into the local population around your data points.
- Provide in-depth, interactive context about both reference layers and your data using the configurable feature information pane.
- Add customizable information cards to your map that contain regional facts to enhance your data.
Add context to your reports
Demographics added to your report metrics improve your spatial analysis and provide visual and contextual depth.
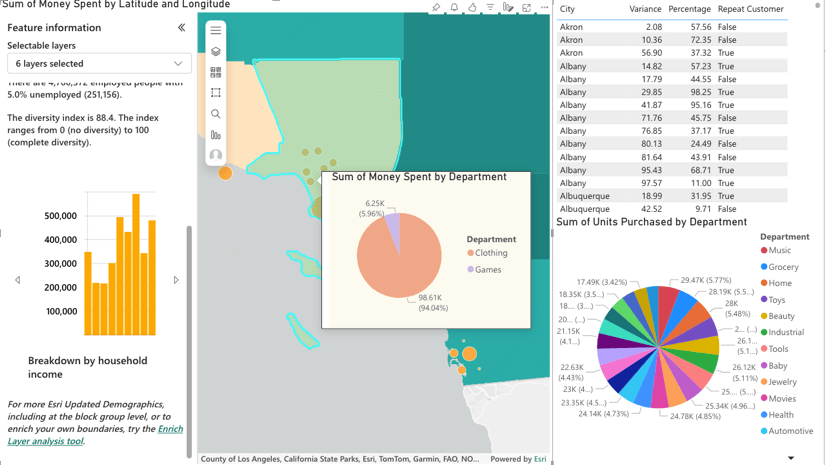
For example, in the below image, the top half of the image represents sales metrics by location added to an ArcGIS map visualization from your Power BI dataset.
The bottom half of the image shows one way to enhance this dataset by adding a reference layer from a curated list of available demographic data, along with a feature information pane and information card.
 and with a demographic layer (bottom)")
In this example, you might be looking for the right place to add a new store location to increase sales. By adding the U.S. Census Bureau 2020 Median Disposable Income layer, you can visualize where on the map to find population with additional income to spend on your products. These are the areas shaded green and brown: darker color = greater amounts of disposable income. You can also see how these population clusters may affect your existing stores and their current sales metrics.
Demographic data refinements
You can continue to refine your results by adding metrics like population age or family clusters to do the following:
- Make advertising decisions that target regional audiences appropriately.
- Forecast regional purchasing trends to influence future product or brand buying decisions.
The scope of available demographic data and variety of ways you can use it to improve your spatial analysis are extensive. With an ArcGIS account, you can access an even richer catalog of data refinements to clarify your map visualization. See the Accounts topic to explore the capability differences between a guest user and users with an ArcGIS account.
U.S. demographic data layers
ArcGIS for Power BI guest users can add the following demographic data reference layers to any map visualization:
| Demographic | Description |
|---|---|
| Average Household Income | A baseline household wealth metric: divides regional household income by the total number of households in that region. |
| Average Household Size | Divides the number of people who live in households in a region by the total number of households. |
| Diversity Index | Summarizes a region’s racial and ethnic diversity. Ranging from 0 (no diversity) to 100 (highest diversity), this number increases when the region’s population includes more ethnic groups. |
| Median Age | Younger or older neighborhood? Provides a median (middle) value for the local population’s age. |
| Median Disposable Income | Spending money? Establishes a median (middle) value for the local community’s available disposable income distribution (assets after bills). |
| Median Household Income | An income metric, this number establishes a median value for the region’s household income. |
| Median Home Value | How much does it cost to live in this region? This metric provides the median value for the region’s (owned) homes. |
| Per Capita Income | How wealthy is this region as a whole? This metric divides the region’s aggregate (total) income by the region’s total population. |
| Population Density | How many people per sq. mile? This metric divides the total regional population by the total land area. |
| Population Growth | Is this region’s population booming? This metric describes the positive or negative direction and magnitude of change for the total regional population in five-year projections. |
Wrapping it up
In addition to these demographic data types, you can use ArcGIS for Power BI to search for publicly shared feature layers. The ArcGIS library contains thousands of reference layers with information specifically curated to enrich your data.
You can find business district data, consumer studies, survey results, and much more. Further, when you sign in to your ArcGIS account to add content to ArcGIS for Power BI, you have access to yet more authoritative data content. This includes the ArcGIS Living Atlas of the World data library, shareable with your organization and groups.
If you have a Microsoft Fabric license, you already have access to ArcGIS for Power BI and can start using ArcGIS map visualizations with demographic data enrichment today. You can also sign up with Esri for a licensed ArcGIS account to create detailed map visualizations with spatial analysis using licensed, premium features.
To learn more about ArcGIS for Power BI, start with Esri’s ArcGIS for Power BI online help, explore ArcGIS for Power BI videos, or visit the ArcGIS for Power BI Esri Community page to read examples and testimonials.

Commenting is not enabled for this article.