Today, I want to discuss how you can use Scene Viewer to style and configure point clouds directly in your browser, interactively, and intuitively, leveraging the power of smart mapping smart defaults and color ramp sliders. Cities across the world are leveraging the power of point clouds to visualize and present their 3D data, and the smart mapping styles in Scene Viewer give you the ability to customize your visualizations of point cloud data to suite the unique needs of your projects. All you need to do is sign in to ArcGIS Online and you’re on your way.
Explore point cloud styles
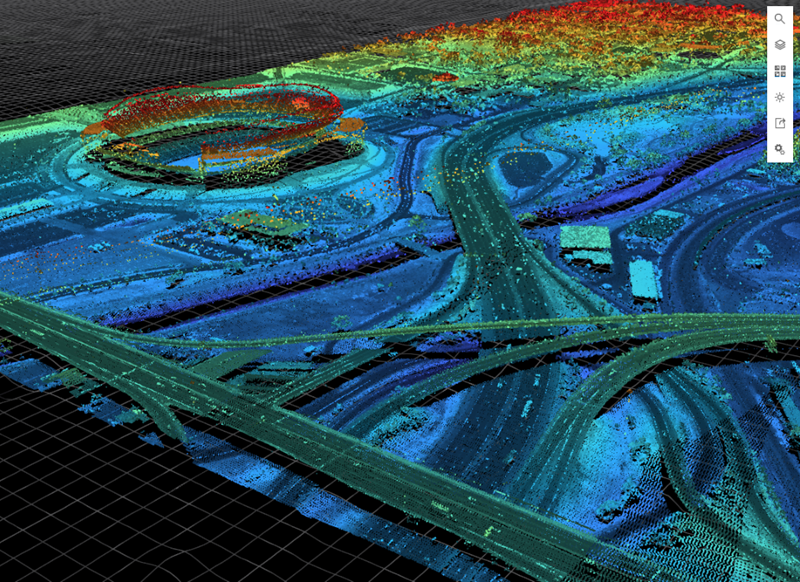
To visualize point cloud scene layers, I can choose one of the different smart mapping drawing styles available based on the point cloud attributes: True Color, Class, Elevation, and Intensity. Each style has its own strengths and value depending on the scene I’m trying to create. For example, I can use the Elevation style to explore and understand the changing elevation of the structures and terrain in my scenes.
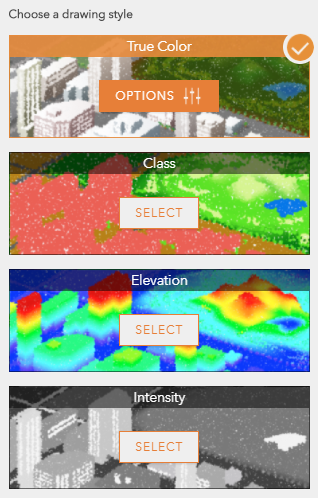
Hint: The smart mapping styles also include an easy-to-use slider that lets me manually change the point size from smaller to larger and vice versa. Furthermore, if my point cloud layer doesn’t match the terrain, I can apply an offset to my point cloud layer to align it better.
Show your true colors
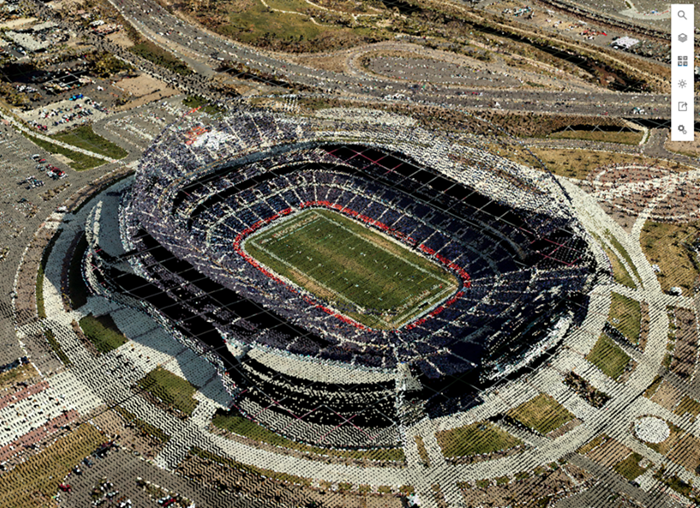
If I’m interested in displaying the realistic look and feel of my city or landscape, I would choose the True Color style because it displays point cloud data with the true RGB values collected in the LiDAR remote-sensing process. For example, this scene of Mile High Stadium in Denver, Colorado really got my attention. The scene showcases point cloud data created by Merrick and with the True Color style chosen, I can even clearly see the team name “BRONCOS” spelled out in the end zone!
Can I see my point cloud data classified?
With the Class style, I can assign a specific color to the classes in the point cloud data defined in the collection process. This is helpful when I want to emphasize and distinguish the most important elements of my scene, such as buildings, plants and vegetation, and ground. When I open the Class style, I can see what classes are available by looking at the list and also in the legend.

Hint: If I turn the “Modulate using intensity “option on, I can shade the color of the points based on the intensity value (see the Intensity style below). This improves depth perception and perspective of my point cloud scene when many nearby points have the same color. By adding this option and playing around with the class colors, I can see much more detail, such as the roads and roof structures.
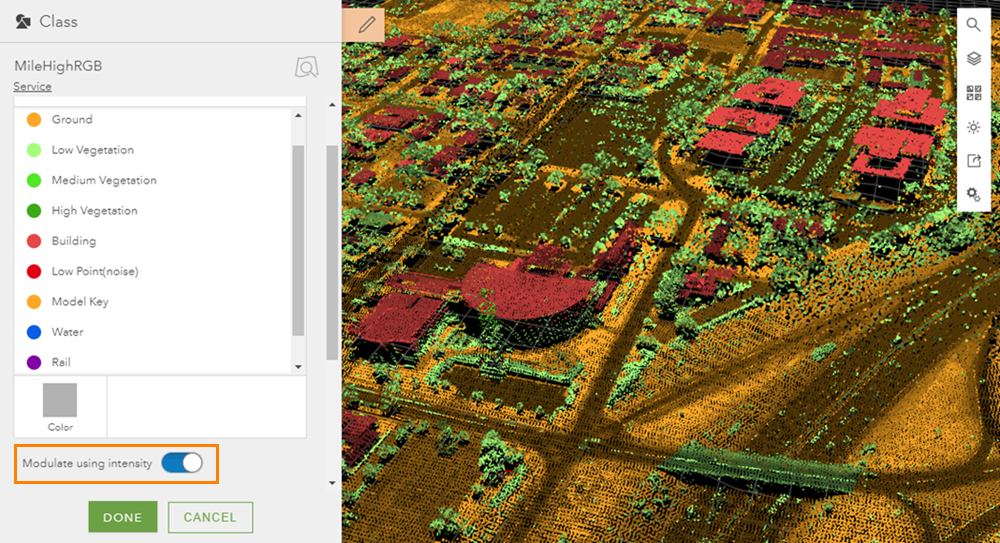
Also, in case you’re wondering what those trees are doing on the highway, please don’t call the forest service. They’re actually cars. However, LiDAR scanning is not a perfect science and sometimes automated classification fails and puts some points in the wrong category.
What I’d really like to see is the elevation of my points
I chose the Elevation style to visualize this Helsinki scene I created to emphasize the higher areas and structures. Knowing the elevation of buildings and terrain throughout Helsinki is very important from an urban planning, environmental, or industrial perspective. For example, if I am in the shipping or utilities industries, I may want to focus on structures higher than a certain height, such as cargo cranes or power lines. I can adjust the Elevation style sliders to make the higher areas and structures stand out more.

What is intensity in point clouds?
Using the Intensity style is another great way to see the fine details and textures of Helsinki’s urban landscape. Intensity is a measure of the return strength of the laser pulse that generated the points in the point cloud data collection process. With the Intensity style on, I can get even more detail and contrast in my scene by adjusting the slider to match the distribution of point values.
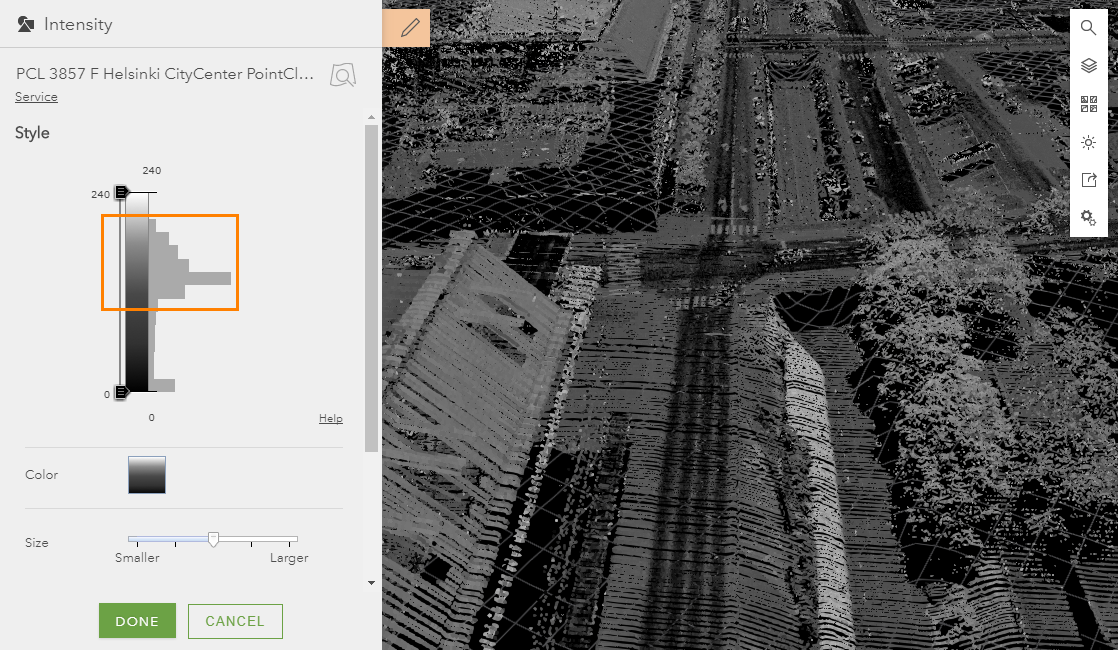
First, I drop down the top slider bar to 190 intensity value. Then I set the maximum value to 200 to reset the distribution of the color ramp.
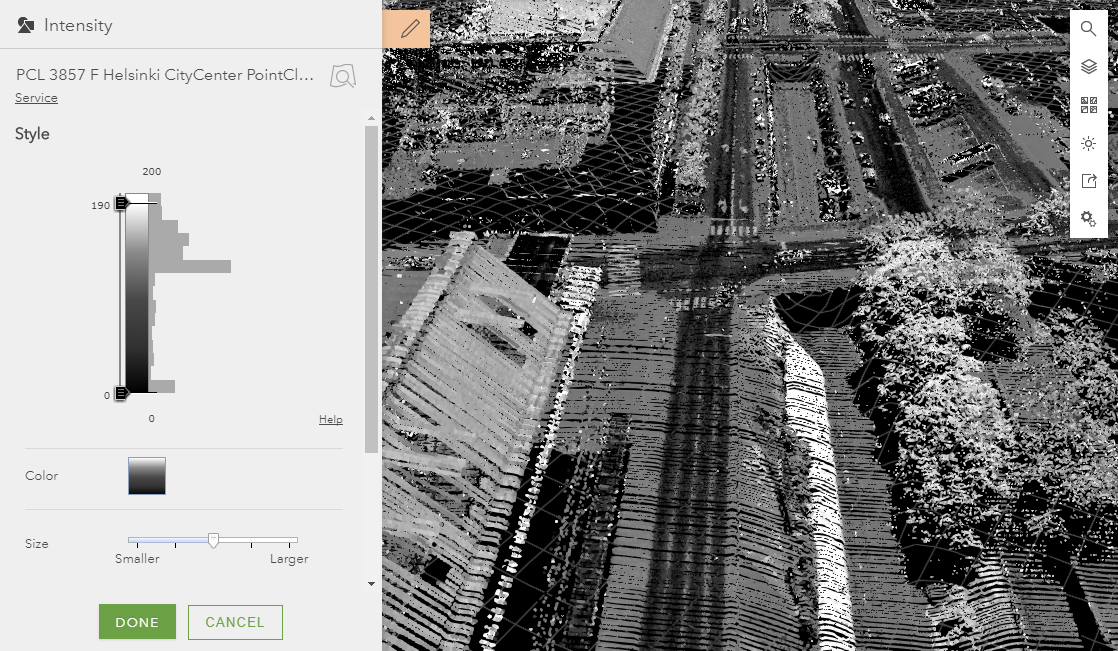
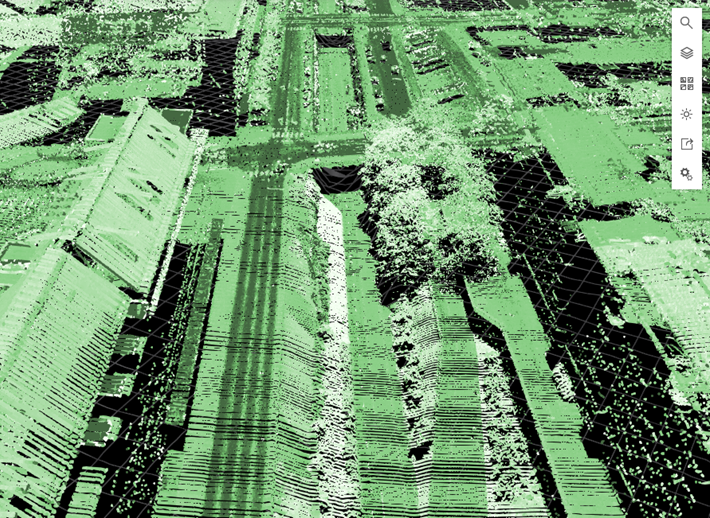
Now I can really see the contrast between the buildings, streets, trees, and canals. All that’s left for me to do is pick out a pleasing color ramp and my scene is finalized.
I encourage you to explore for yourself the power of smart mapping with point clouds in Scene Viewer. To learn more about point cloud smart mapping styles, see style point clouds. And feel free to share your own cool scene creations and comments.
Scenes and screenshots:
- Mile High Stadium point cloud by Merrick | Terms of use
- Helsinki point cloud by City of Helsinki | Terms of use

Commenting is not enabled for this article.