Using your own data is a critical part of your market analysis. You often have organizational information such as:
- Business performance data, for example, sales and number of customers
- Data gathered from public agencies, for example, crime records, public health statistics and economic indicators
- Data sourced from third party vendors, for example, statistical data from local vendors in your country (e.g. additional demographic data)
Business Analyst Web App provides the ability to configure these type of custom data so you can aggregate them for your specific study area (i.e. 15 minutes drive time area or a custom geography). This data can then be compared to other data provided in Business Analyst so you can find relationships and patterns with your own data and demographics in the study area.
Using the Custom Data Setup workflow, you can use your own organizational data the same way you use Esri Demographics data in the mapping, analytics, infographics, and reporting workflows in the Business Analyst Web App.
The setup allows you to select an ArcGIS feature layer with your data and configure the layer so you can map and aggregate variables just like Esri’s demographics data.
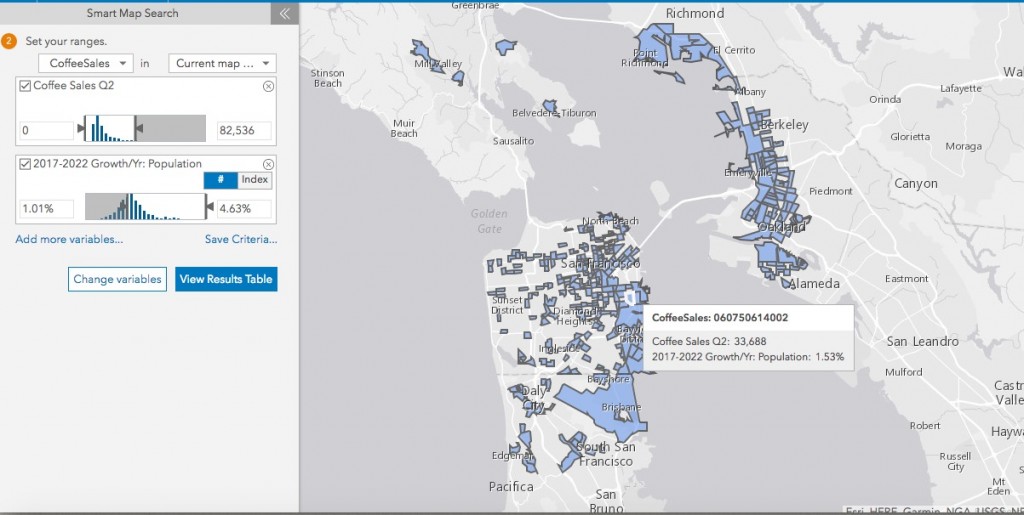
Imagine you run a chain of coffee shops and you have coffee sales data summarized by zip codes. You want to find zip codes with low sales and high population growth to identify areas where there is potential to grow your business. By using Smart Map Search on the coffee sales data along with the population growth data, you can easily find such zip codes and plan a targeted marketing campaign to help grow business.
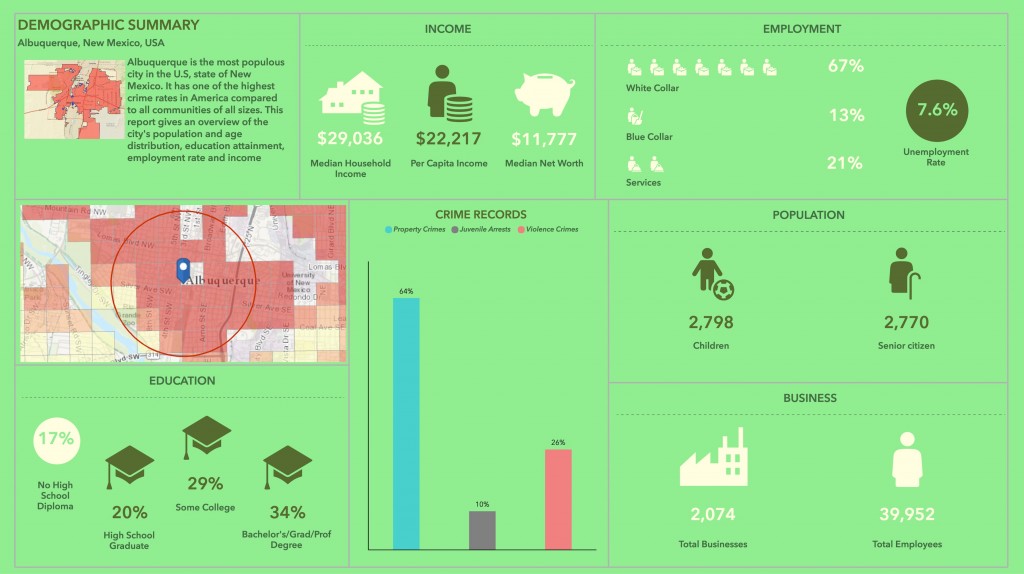
Or let’s say you work for a city, you have crime records data by Census Tracts, and you want to understand the correlation of crime statistics with demographics, identify areas with high population of children and senior citizens, and provide reports to help prioritize services in the most vulnerable areas. You can simply use the crime records data along with Esri’s population by age, key population, income, and household variables and create a beautiful and engaging infographics to present these key indicators.
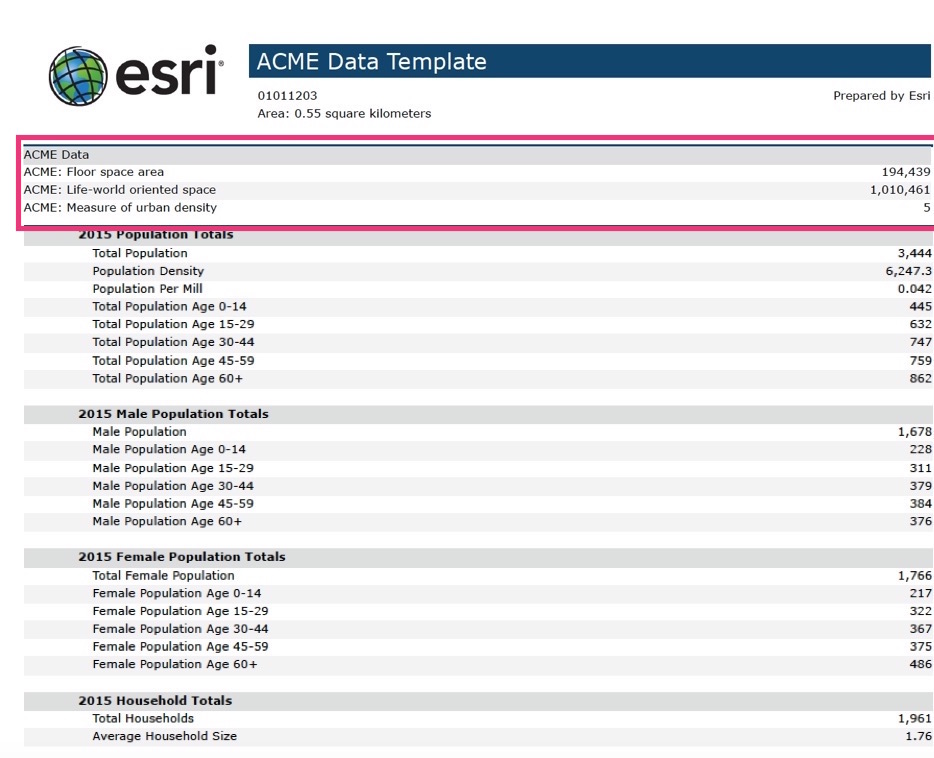
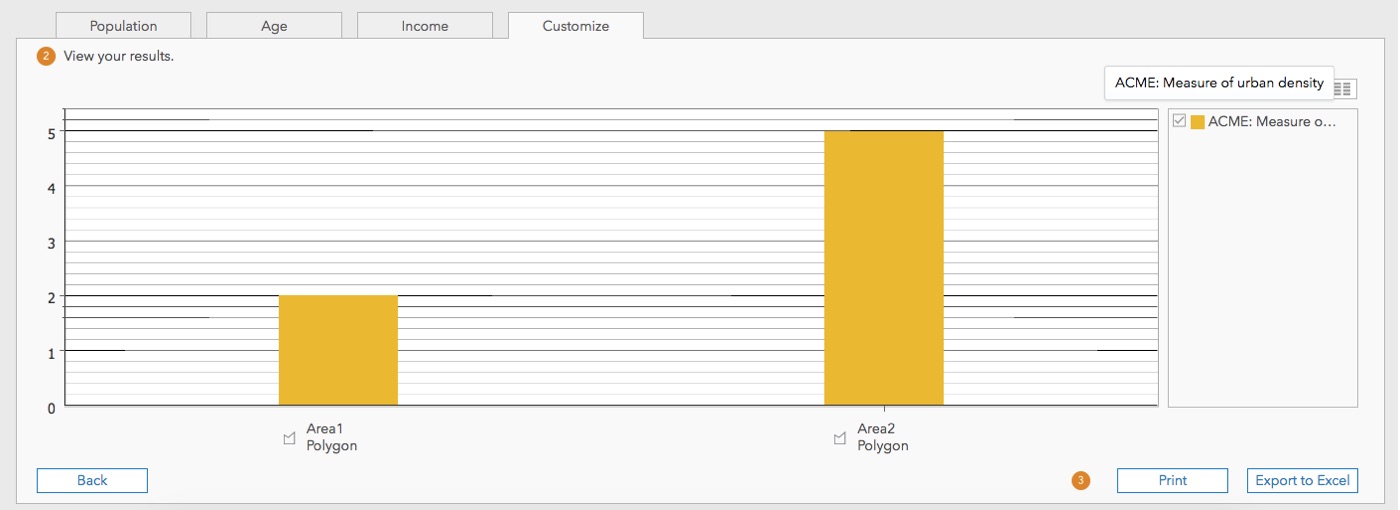
Another scenario will be, in case you are working on a global project and want to compare two target areas in Berlin, Germany for urban development. You need to provide market analysis reports to the city planners that help them understand urban density along with demographics. They prefer the data source for the urban density measure from a local data vendor (e.g. ACME data). You can easily bring in and use that data in the Business Analyst Web App to provide analysis reports to city planners and compare key economic indicators of two cities side by side.
The following 3-steps provide an illustrated walk through on how you can use the custom data setup feature to configure your own data in Business Analyst.
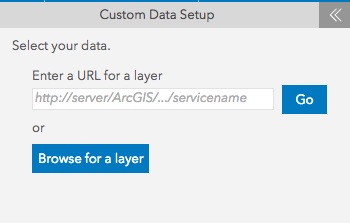
In the Maps tab, use Add Data > Custom Data Setup to start this workflow to import your data
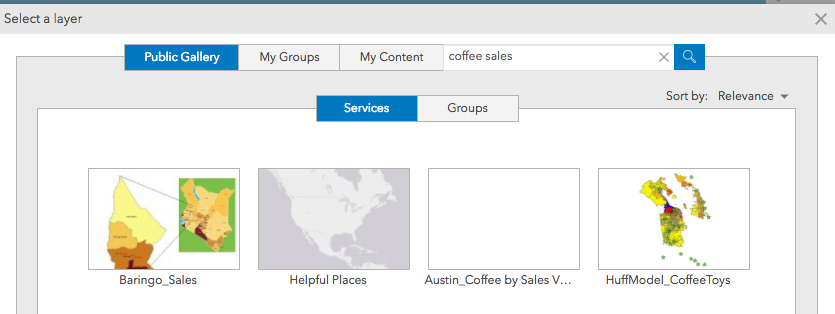
1. Browse for the organizational data in the ArcGIS portal or enter the layer’s URL. For example, a coffee sales data layer. The feature layer you select must support “query” and have at least one numeric field that you want to aggregate.
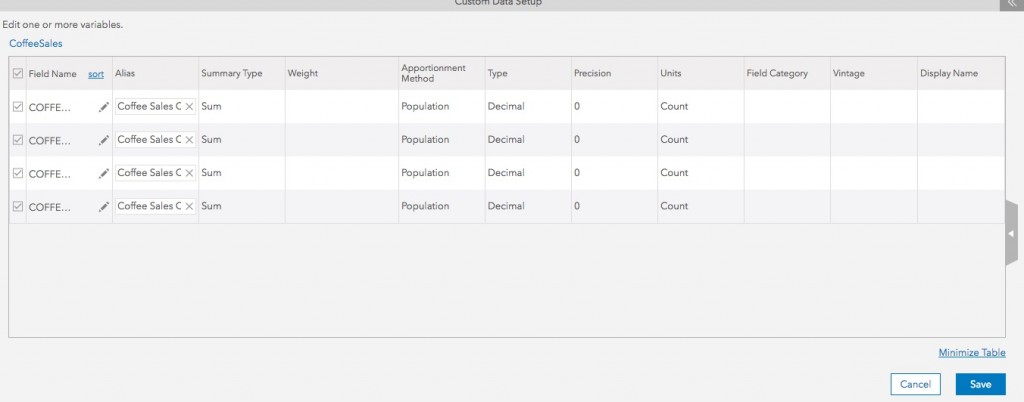
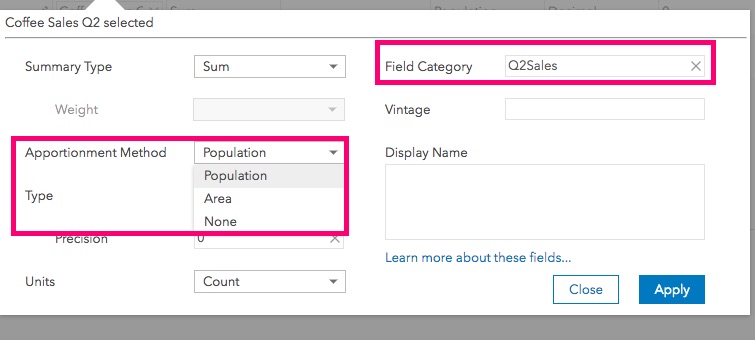
2. Set up how your data will be displayed and aggregated.
For example, Field category option gives you the flexibility to organize data variables in different folders. While, Apportionment Method defines how a variable is weighted to a portion of geography.
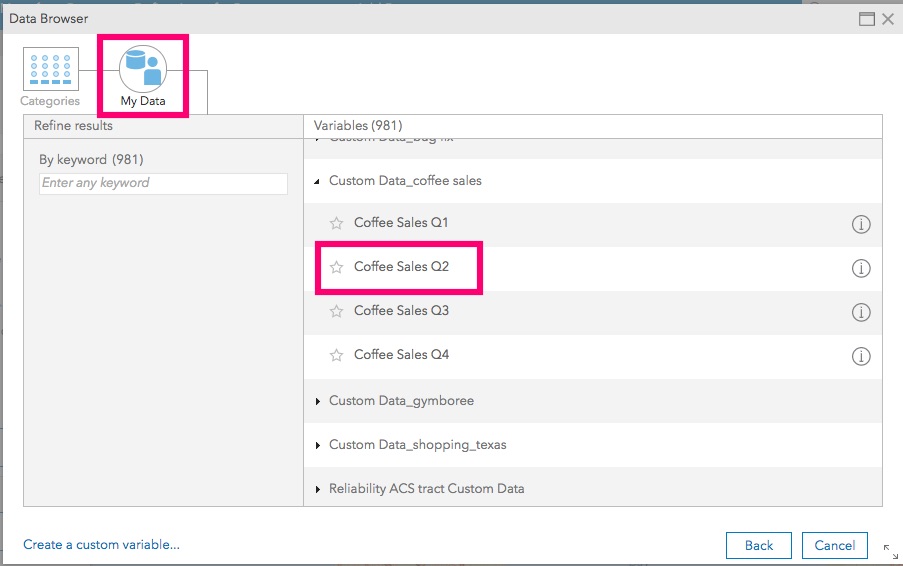
3. This is it! your data is set and readily available to be used within various workflows. Once you have finished setting up the custom dataset, the data can be used to create maps, reports and infographics just like Esri provided data. The custom data can be accessed in the data browser under the “My Data” category.
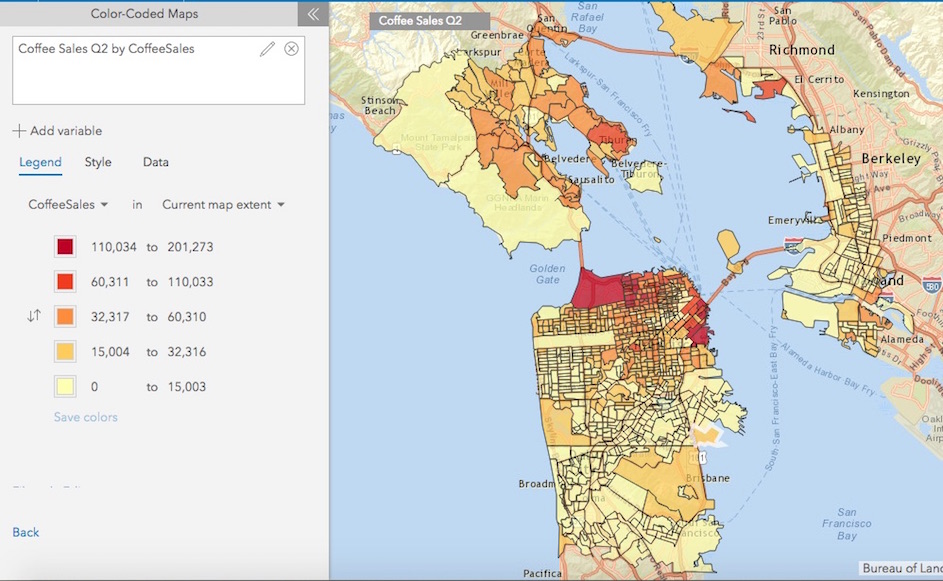
For example, select a variable and see a color-coded map of coffee sales being created for you.
Optionally, you can share the custom data with the rest of your organization and help other users from repeating the set up process and can readily leverage the data in mapping, analysis, reports and infographics.
Thanks for stopping by! Watch & learn more about the Custom Data Setup on the help documentation
http://doc.arcgis.com/en/business-analyst/web/custom-data-setup.htm
To learn custom data setup on the GE side, link to this blogspot
https://blogs.esri.com/esri/arcgis/2017/07/07/83043/




Article Discussion: