Spatial analysis is the process of geographically modeling a problem or issue, deriving results by computer processing, and then examining and interpreting those model results. The spatial model that you create is based on a set of tools that apply operations on your data to create new results.
Data Items and Tools
Each geoprocessing tool performs a small yet essential operation on geographic data, such as adding a field to a table, creating buffer zones around features, computing the least-cost paths between multiple locations, or computing a weighted overlay to combine multiple layers into a single result.
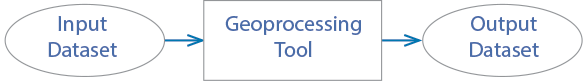
A typical geoprocessing tool performs an operation on an ArcGIS dataset and produces new data as the result.
ArcGIS contains hundreds of analytical tools to perform just about any kind of analytical operation using any kind of geospatial information. For example, see the comprehensively rich set of operators found in the geoprocessing toolboxes that come with ArcGIS Pro. ArcGIS Pro also includes ModelBuilder, a visual programming application you can use to create, edit, and manage geoprocessing models.
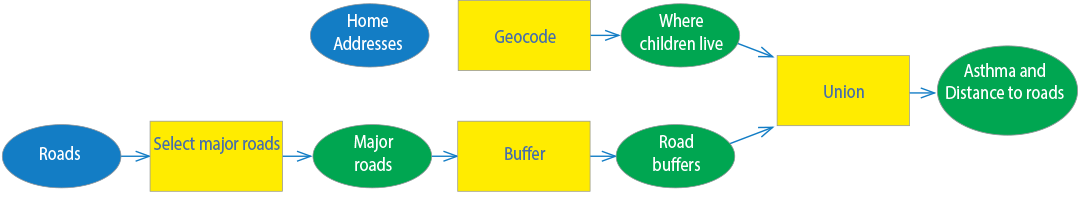
Here is an example of a spatial model created in ModelBuilder that enables the ability to explore potential relationships between the incidence of childhood asthma and air quality from heavy traffic.
Spatial analysis supports the automation of tasks by providing a rich set of tools that can be combined into a series of tools in a sequence of operations using models and scripts. Through spatial modeling, you can chain together a sequence of tools, feeding the output of one tool into another, enabling you to compose your own model.
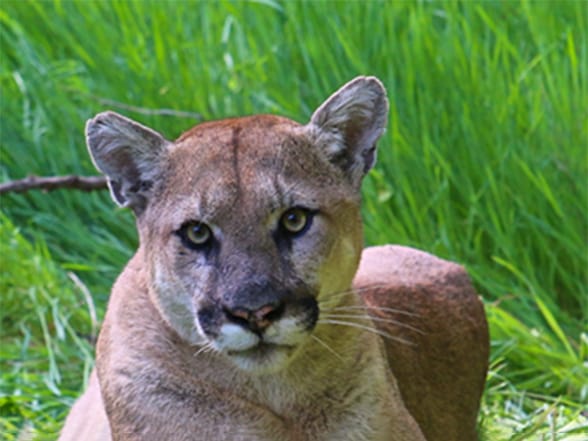
Case Study: Modeling Mountain Lion Habitat
The metropolitan area of Greater Los Angeles region extends to 4,850 square miles (12,561 square kilometers) and represents the second-largest metropolitan area in the United States. The region has retained some of its original natural areas, and in the mountains surrounding the metropolis, the mountain lions (cougars) are the largest carnivores that live, hunt, and breed in this Southern California area. Our challenge is to ensure they survive. By connecting their remaining natural habitats to one another, in theory, this will allow the animals to seamlessly move between them.
This study analyzed ways to connect cougars located in several core areas with cougars in other geographically separated core areas. You will identify potential wildlife corridors that researchers and authorities can use to develop physical connections between cougar habitats located in the Santa Susana Mountains with habitats in the Santa Monica Mountains, the San Gabriel Mountains, and in the Los Padres National Forest. The complete workflow is described in the Learn ArcGIS lesson below.
Suitability/Corridor Model

Learn ArcGIS Lesson: Big Cats, Big Challenges—Claws, Cars, and Casualties
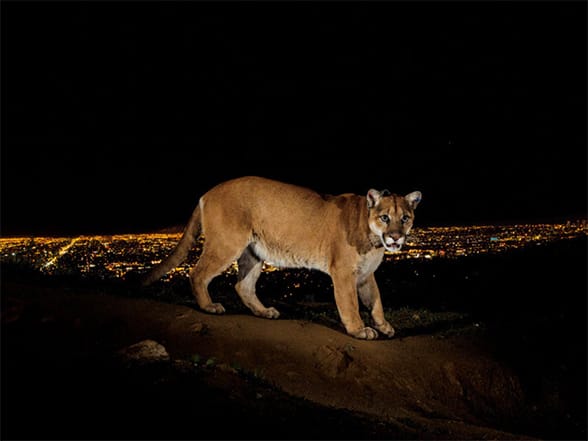
The mega city of Los Angeles is one of the few world cities that have big cats living within the natural areas of the city. But the city landscape is becoming increasingly fragmented by urban development, roads, and freeways, thus leaving less space for mountain lions (cougars) to survive. As they attempt to cross roads and freeways in search of prey and mates, cougars often get struck and killed. For the Los Angeles cougar population to survive as well as maintain genetic diversity, and overall population health, a long-term solution must be found that will allow them to move safely between the isolated pockets of land they currently occupy.
In this project, your goal is to identify current cougar distributions and build a spatial model that identifies corridors we can establish to connect the various core mountain lion habitat areas within the city to each other.
The workflow emphasizes setting analysis goals which lead to questions that will give meaningful results. Following the workflow, you will examine and interpret analysis results, seek explanations for observed patterns, and explore their meaning from a spatial or temporal perspective. A strong emphasis of this workflow is on locating and using community and Living Atlas of the World data, and then contributing and sharing results and findings back to the community. The workflow also emphasizes the use of infographics and GeoEnrichment tools to provide deeper explanations and support for further inquiry.
—–
This post is excerpted from The ArcGIS Book, Second Edition: 10 Big Ideas about Applying The Science of Where, by Christian Harder and Clint Brown. The twin goals of this book are to open your eyes to what is now possible with Web GIS, and then spur you into action by putting the technology and deep data resources in your hands. The book is available through Amazon.com and other booksellers, and is also available at TheArcGISBook.com for free.
Commenting is not enabled for this article.