What’s new in ArcGIS API for Python v1.3
We are pleased to announce the newest release of the ArcGIS API for Python (version 1.3) ahead of the holiday season. This version packs some serious enhancements for GIS administration, content management, and performing spatial analysis.
Cloning content from one org to another is a popular use case for many users. GIS administrators and publishers can now leverage the built-in ability to clone items using the latest API. At v1.3, you can pass a bunch of Item objects to the clone_items() method and have those items, and their dependent web layers be cloned along with their content and metadata. The API takes care of swapping the URL in the web maps and apps to match the new web layer URLs.
Admins can work with and manage their unfederated ArcGIS Servers. The ‘server’ module of the API has been enhanced to support authenticating and working with stand-alone ArcGIS servers.
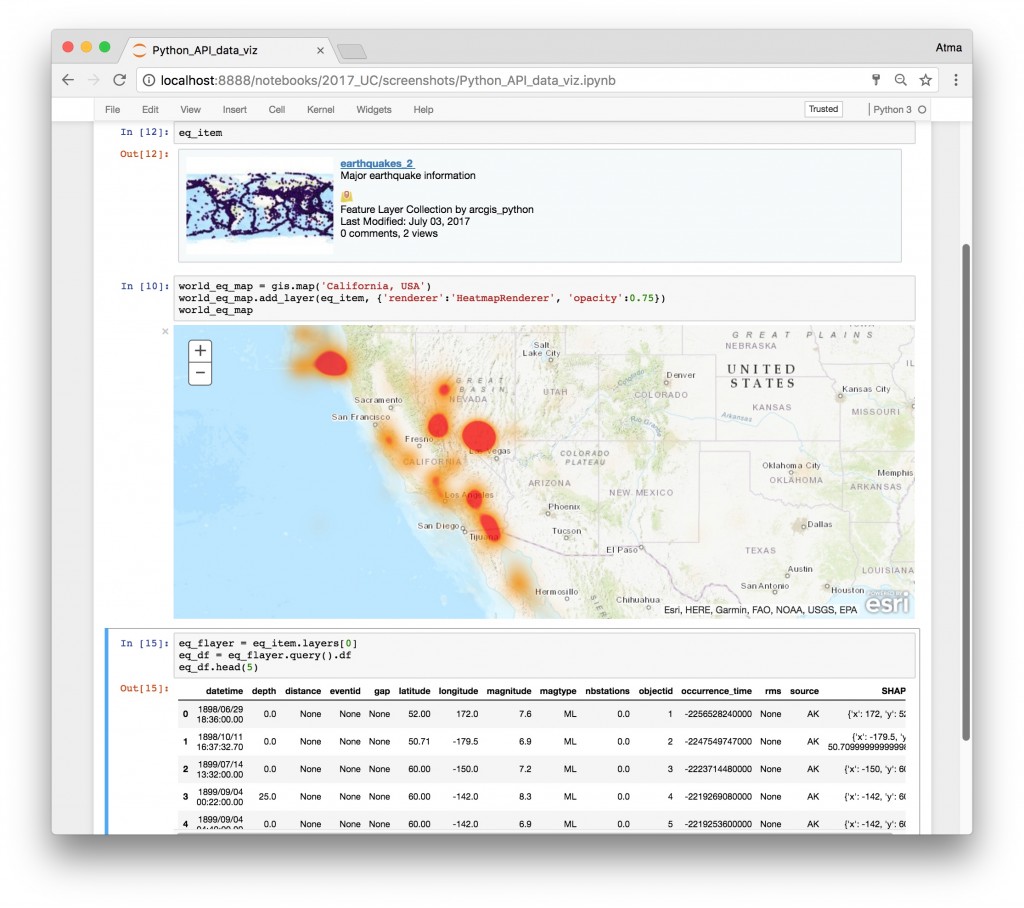
At 1.3, the API has brought to life a feature that many users have been asking for. You can now easily save your map widget into a web map. The map widget in Jupyter notebooks has been enhanced to list the layers you added, remove them interactively and finally save the widget into a web map. This lets you save your outputs and analysis results for use in other ArcGIS applications. In addition, the WebMap class has been enhanced and lets you author and edit web maps. Analysts and publishers can then create web maps when using the API in a headless or script mode.

When performing an analysis, often you face questions such as, “who are the people that live in this area?”, “how diverse is this neighborhood?”, “what is the average commute times and mode of transportation for residents of this zip code?”. Enriching your GIS data set with socio-economic attributes like these will greatly enhance explaining a prevailing geographical phenomenon or will simply add more context to the conclusions that you are drawing specifically from your analysis work. With the newly added ‘geoenrichment’ module, users of the Python API can call into the ArcGIS GeoEnrichment Service and collect demographic and other thematic information about their study areas. To empower your imagery analysis, many raster functions have been added.
In addition to these new capabilities, several enhancements and bug fixes have been included in the 1.3 release. Check out the release notes for more details.
Learning resources
With the new year upon us, are you thinking about any resolutions? If learning and using Python API isn’t one, we encourage you to consider making it one. Check out this video recording from the GeoDev Webinar Series to get a broad perspective of what you can do with the API. Also, add the recent ArcUser article “Harness the Power of GIS with the ArcGIS API for Python” to your holiday reading list. Still not convinced about Jupyter notebooks? Check out this blog post: A Whole New Way to Experience GIS
From the Python API team, we wish you very happy holidays!

Commenting is not enabled for this article.