The ArcGIS API for JavaScript 4.2 is available, introducing new widgets, smart mapping in 2D and 3D, vector tiles in 3D, support for Arcade, and new events in the MapView and SceneView.
Custom widget development
In addition to the Esri-provided widgets, it is now possible to create your own custom widgets using the new widget framework. This framework allows you to create subclasses off of the Widget class. For additional information on this, please refer to the Widget development guide topic, in addition to two new samples showcasing this functionality:
Currently, LayerList and Print are the two widgets that use this new framework. The remaining ready-to-use widgets, (e.g. Home, Search, etc.) are planned to be updated in subsequent API releases.
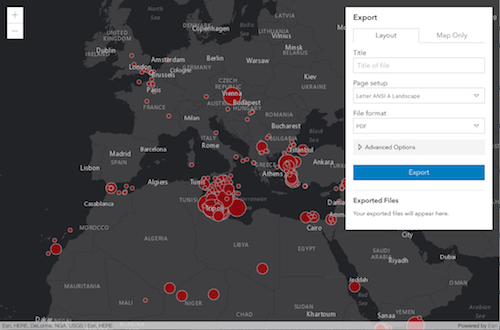
Print and LayerList widgets
The LayerList and Print widgets have been designed from the ground up with a clean user experience and responsive design. Both follow the API’s view model architecture for extensibility and customization.

Arcade expressions in visualization
Arcade is a lightweight expression language designed for creating custom content, visualizations, and labels across the ArcGIS platform. In the 4.2 release of the API, Arcade is exclusively used for custom data-driven visualizations. Rather than base visualizations on the value of a layer’s field, users now can pass an expression to renderers and visual variables. The expression will execute for each feature, generating a symbol based on the returned value. This is convenient when a service doesn’t have the exact values you need. Arcade comes equipped with its own library of functions and allows users to write custom functions within an expression.
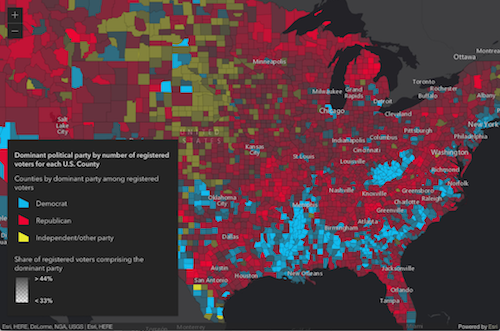
The following snippet demonstrates how you can write an Arcade expression showing the share of the vote earned in an election by the winner for each geography in the layer.
// CANDIDATE1 and CANDIDATE2 are field values
var arcade = "var votes = [$feature.CANDIDATE1, $feature.CANDIDATE2];"
  // Sum() and Max() are built-in Arcade functions
  + "return ( Max(votes) / Sum(votes) ) * 100;";

renderer.visualVariables = [{
  type: "color",
  // valueExpression references the Arcade expression
  valueExpression: arcade,
  valueExpressionTitle: "Share of winner's votes",
  stops: [ ... ]
}];
Arcade is convenient for a number of reasons, including providing the ability to save expressions to layer items and web maps in ArcGIS Online or Portal for ArcGIS. That means expressions can be authored in apps and persisted in webmaps throughout the ArcGIS platform. In future releases, users will have the ability to use it in other contexts, such as labeling.
Be sure to read the full Arcade documentation for details about its syntax and the Arcade guide page for more examples of its usage within the API. The Create a custom visualization using Arcade sample demonstrates how Arcade can be used in this context.
For an introduction and some ideas for mapping using Arcade, read the content shared in the previously released blog articles.
Revamped VectorTileLayer support
The implementation of the VectorTileLayer has been re-written to be more tightly integrated with the API. It still fully supports the current Mapbox Style Specification (version 8) and MapBox Vector Tile specification (version 2.1). The enhancements with this first release of the new vector tile implementation include: support in 3D SceneView, right-to-left (RTL) support for map labels, support for any ArcGIS-supported spatial reference, and improved label and symbol display on tile boundaries.
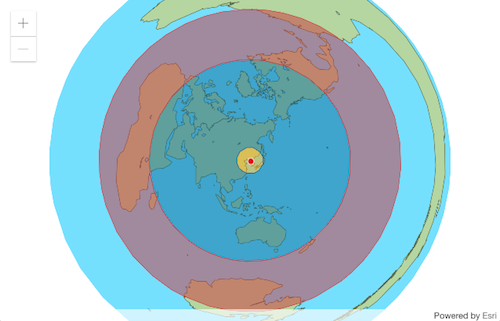
North Korea Missile Azimuthal Equidistant
New events on MapView and SceneView
The following keyboard and pointer events are now available on MapView and SceneView:
- double-click – fires after double-clicking on the view.
- drag – fires during a pointer drag on the view.
- key-down – fires after a keyboard key is pressed.
- key-up – fires after a keyboard key is released.
- mouse-wheel – fires when a wheel button of a pointing device (typically a mouse) is scrolled on the view.
- pointer-down – fires after a mouse button is pressed, or a finger touches the display.
- pointer-move – fires after the mouse or a finger on the display moves.
- pointer-up – fires after a mouse button is released, or a display touch ends.

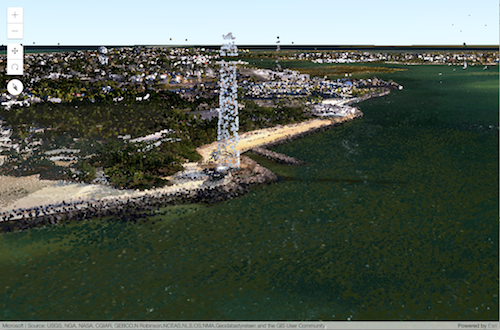
Point clouds
Point cloud data can be visualized using the new PointCloudLayer and PointCloud renderer classes. Visualizing point clouds in different ways can help extract important information. With the JavaScript API, point cloud data can be visualized with RGB values, unique values, continuous color or stretched values, or class breaks.
See the Point Cloud Layer sample for more details on this topic.
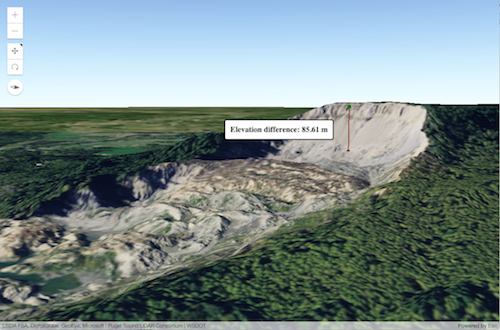
Elevation Query API
Elevation values, or z-values, in 3D SceneViews can be obtained for a given point in a couple of ways. One is via the hitTest() method, which provides an approximate elevation for a given ScreenPoint. Starting at version 4.2, you can now query more precise elevation values for points and polylines directly from an ElevationLayer with the queryElevation() method.
The image below links to to a sample that demonstrates how you can query elevation at the same location from two elevation layers: one representing the surface before a landslide and the other after the landslide. You can then calculate the elevation difference based on the results.
Also be sure to check out another new sample demonstrating how to query Elevation along a line.
Improved smart mapping
Data-driven and simple location-based visualizations can be generated using smart mapping using methods in one of four objects new to the API for generating renderers with smart default symbols:
- location – generates a single symbol for all features in a layer.
- color – generates data-driven visualizations with continuous color based on a numeric field value.
- size – generates data-driven visualizations with continuous size based on a numeric field value.
- univariateColorSize – generates visualizations with continuous color and size ramps based on a single numeric field value. This type was designed specifically for visualizations using 3D symbols.
Three widgets were also added: ColorSlider, SizeSlider, and UnivariateColorSizeSlider providing users with the ability to easily explore spatial patterns in their data and update data-driven visualizations to highlight alternate nuances of the data such as emphasizing outliers, similar features, or features with values above or below a certain point.

The visualization generator workflows are designed for allowing users to explore unfamiliar data and/or save custom visualizations to portal items (layers, webmaps, webscenes) with a simple UI.
The following are new samples demonstrating how the renderer generators and slider widgets work together.
- Generate data-driven continuous color visualization
- Generate data-driven continuous size visualization
- Generate univariate continuous size and color visualization in 3D
Custom goTo() animations
When user orientation and correlation between the two locations is important, changing view center to a new location should be done smoothly. With this release the duration of the animation as well as an easing function can be given for better control of the animation mode.
In the example below the camera speed grows gradually (to the power of 3), but limits the duration to 4 seconds.
view.goTo(newLocation, {
  duration: 4000,
  easing: "in-cubic"
});
Workers framework
The workers framework helps improve performance by offloading computationally expensive tasks to background threads, without blocking the user interface running on the main thread.
Check out the 4.2 release notes for additional information about upgrades to other resources and a more detailed listing of API enhancements. For an overview on what was released with 3.19 earlier this week, check out this blog announcement.


Commenting is not enabled for this article.