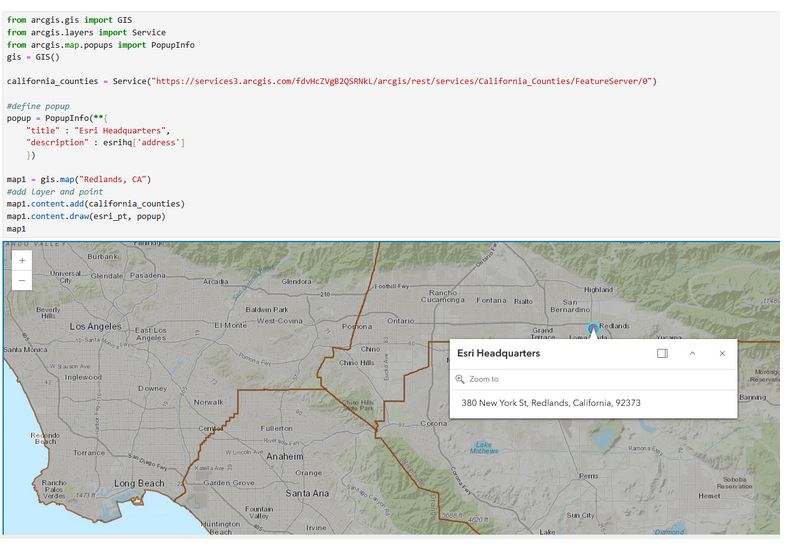
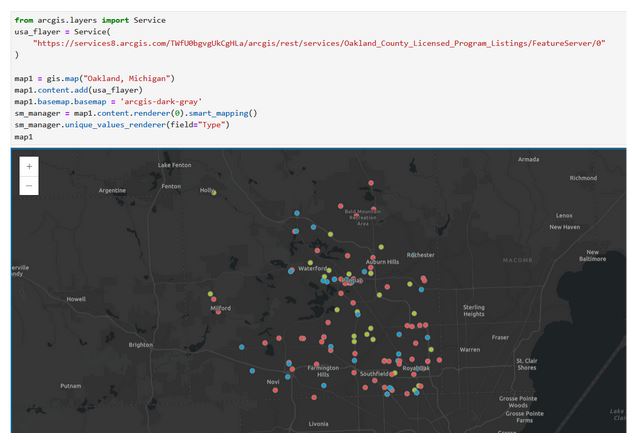
The ArcGIS API for Python version 2.4.0 introduced significant changes in the structure and usage of the mapping functionality within the API. While the primary motivation for the transition was to align with the next generation of Jupyter Notebooks (Jupyter Notebook 7 and JupyterLab 4), it also presented an opportunity to modernize the implementation of this functionality. This led to a new map widget with enhanced mapping and visualization capabilities. Here are some important highlights from this change:
1. Refactoring of Mapping modules and classes
The ‘arcgis.mapping’ and ‘arcgis.widgets’ modules have been deprecated and the functionality has been refactored into the two new ‘arcgis.map’ and ‘arcgis.layers‘ modules. As a result, WebMap and MapView classes that were previously used to work with 2D data have been replaced by the Map class, and the WebScene class that supported 3D visualization is now replaced by the Scene class.

2. Integration of the new widget with the ArcGIS Maps for JavaScript
The new map widget supports a recently released version of the JavaScript SDK. This allows you to leverage the JavaScript SDK through the Python API to customize your map as well as apply the SDK’s smart mapping methods. This functionality is implemented through Dataclasses to ensure that the correct JSON structure is provided to the map object while creating renderers, symbols, and popups.
3. Adding content to a map
Using the ‘content’ property (MapContent class) on the Map object, you can now add data in the form of layers or tables to your map and manage symbology for that data using the ‘renderer’ property (RendererManager class). The ‘content’ property can be used to draw geometry objects on your map too. You can also add popup information using the ‘popup’ property (PopupManager class).

4. Map Customization
The Symbology class has been refactored into the ‘symbols’ module and the functionality for generating renderers has been refactored into the SmartMappingManager and RendererManager classes. This version also introduces a new PopupManager class for fine-tuned customization of popups that can be added to the map object. These newer classes enable more dynamic and interactive map visualizations.

5. Map Interaction
The new map widget provides enhanced interactive capabilities, such as zooming, panning, and adjusting the map’s extent. New widgets have been added that enable additional features on the map and improve the overall user experience. These include: bookmarks, legends, a layer list, and a time slider.
Here are the key changes at a glance:
| Until v2.3.1 | v2.4.0 and beyond | |
| Mapping module | arcgis.mapping | arcgis.map |
| 2D mapping classes | WebMap, MapView | Map |
| 3D mapping class | WebScene | Scene |
| Symbology | Symbology class | Symbols module |
| Smart Mapping | ‘renderer’ property and ‘get_renderer()’ method on the data object | RendererManager and SmartMappingManager classes |
| Popups | ‘pop_ups’ property and ‘configure_pop_ups()’ method | PopupManager class |
| Map widget | Legacy widget with limited functionality | New widget with JSAPI functionality |
| Jupyter Compatibility | Jupyter Notebooks | Jupyter Notebook 7 and JupyterLab 4 |
We recently released v2.4.1 of the ArcGIS API for Python (supported in Python 3.10-3.12) with bug fixes and improvements to this new map widget. We encourage you to read through our detailed technical guide that covers the specifics of these features and provides links to the API reference for method signatures and syntax for these new classes. We have also updated our guides and sample notebooks to reflect how these changes will apply to different spatial analysis and visualization workflows. Feel free to reach out to us with your ‘arcgis.map’ questions, suggestions and ideas on the ArcGIS API for Python Esri Community page. You can also use the ArcGIS API for Python public GitHub repo to submit bugs, enhancement requests, and other issues. Happy Mapping!


Commenting is not enabled for this article.