Today, I am going to show you how you can use edge styles in Scene Viewer to accentuate building projects and help your urban planning workflows. It is vital to communicate urban projects in a clear and concise manner to audiences, such as city council members, stakeholders, and the public. To illustrate how you can use edge styles in your scenes, we are going to explore a couple layers with Boston buildings that were demonstrated at the 2018 Esri User Conference. To follow along, you will need to sign into ArcGIS Online when you open the scene below.
Boston scene
Here is a scene of future development projects around downtown Boston. There are Future projects and Current buildings layers.
We can use different edge styles to uniquely emphasize the Boston future projects and, at the same time, add definition to the current buildings without taking attention away from the future projects. Currently in the scene, the future projects and current buildings have different colors but by using edges and smart mapping we can make them even more distinct and add value and information for viewers.
Edges and smart mapping
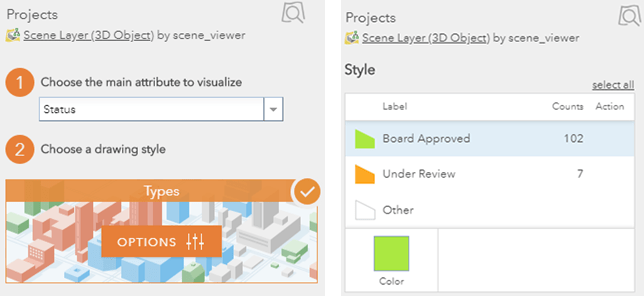
Let’s start with smart mapping and leverage the attributes in the Future projects layer data by visualizing the project buildings by category. We can color the buildings based on the status of the project; Under Review or Board Approved. After choosing Status, we open the Future projects layer and apply the Types style based on the Status attribute and give the types different colors.
Now our scene is starting to tell a more compelling story.
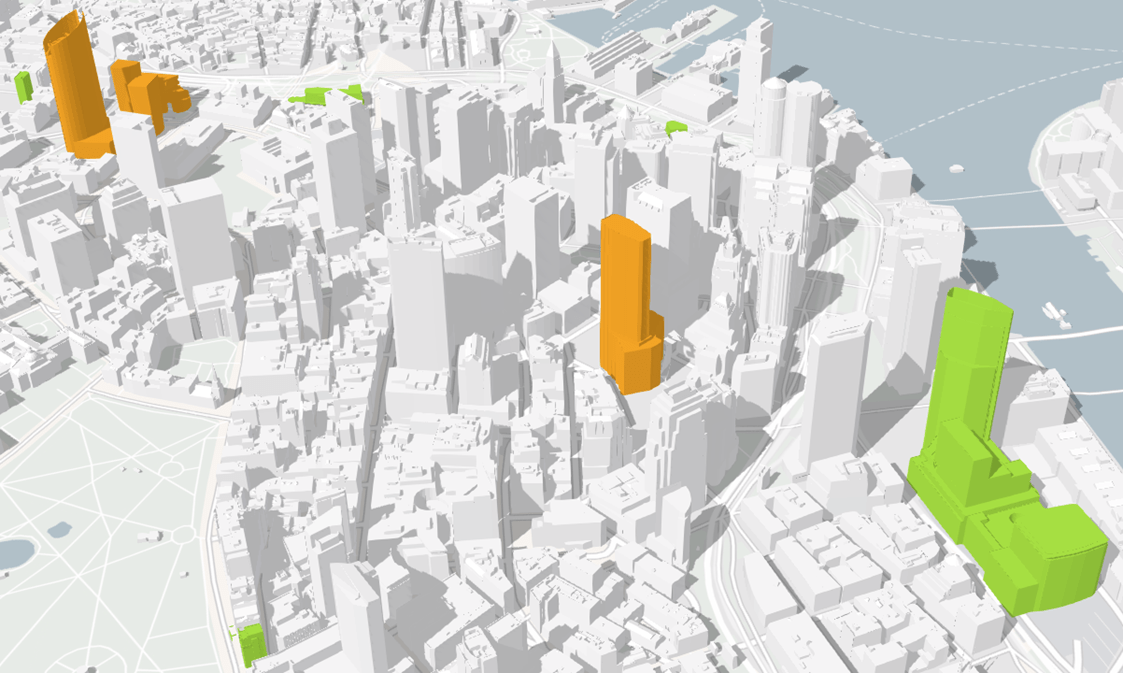
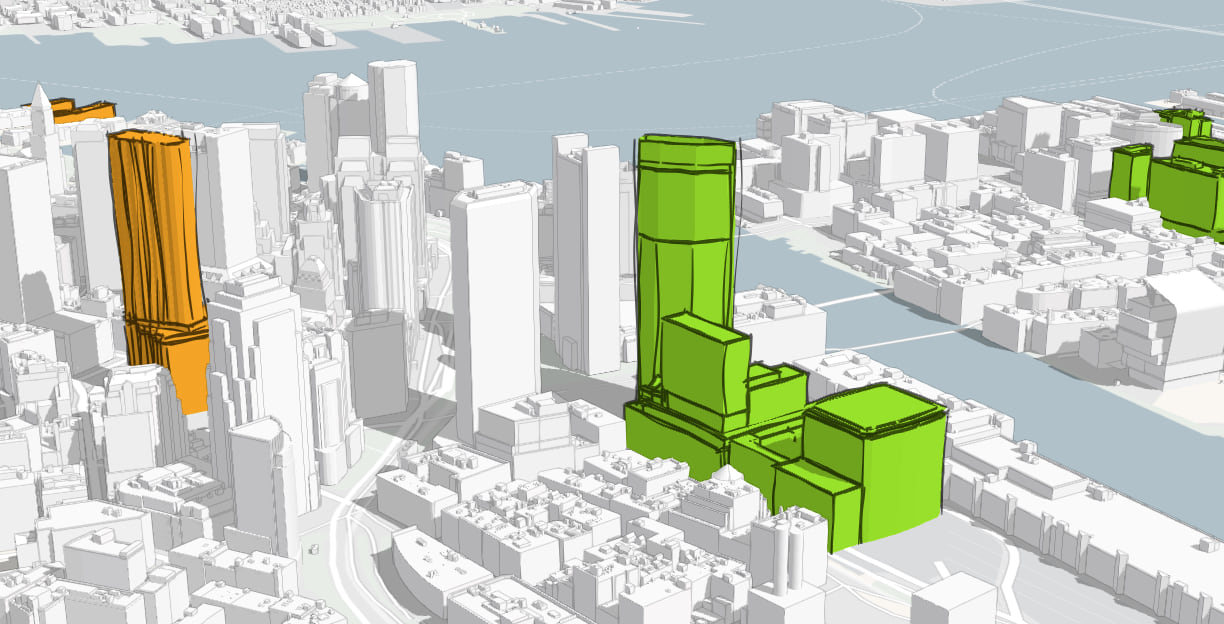
The green projects are Board Approved and the orange ones are Under Review and viewers can naturally inform themselves based on the visualizations. But how can we make the city projects even more distinct? This is where the sketch edge style comes in handy. We can give the future projects a hand-drawn look and define the edges better.
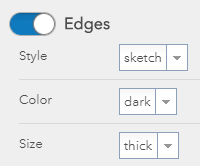
In the Future projects Types pane, we turn on Edges with the sketch style option set to thick.
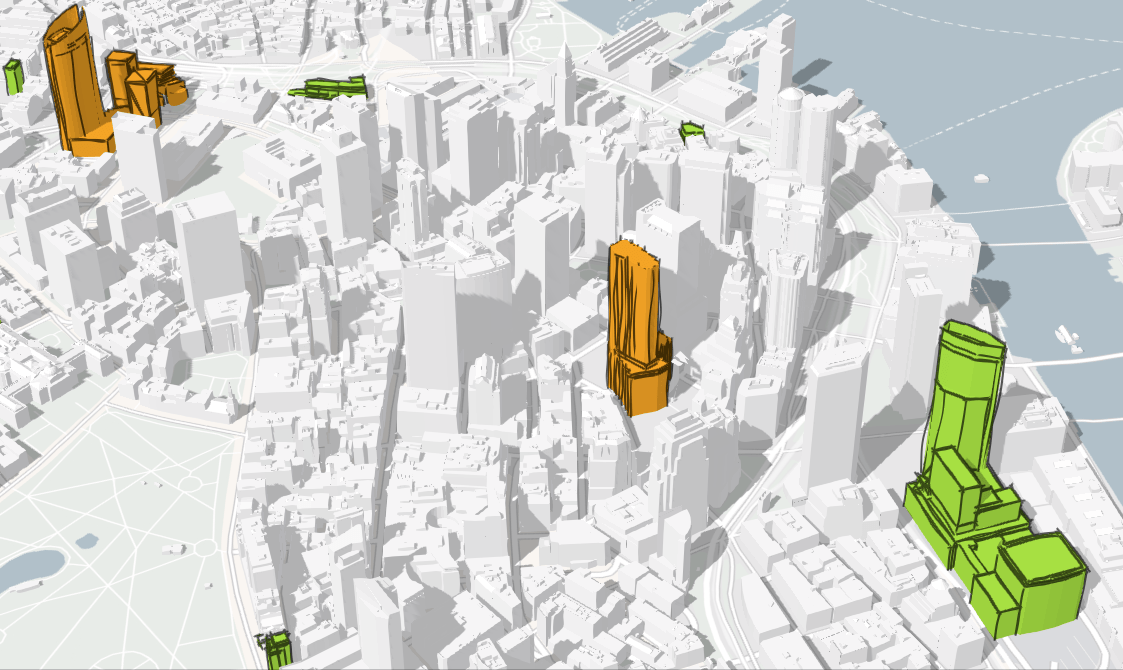
As a viewer, the sketched look shows the defined structures and outlines while giving the impression that these buildings are design proposals. This gives me a better idea how the future buildings will relate and interact with each other in a 3D environment.
Current buildings
Ok. We are good with the Future projects layer but what can we do with the Current buildings layer? The white buildings have very little definition. Maybe if we add a thin edge we can help explain things better. Let’s open the Color style for the current buildings and add a thin dark edge.
That looks better. We can clearly see the current buildings but they don’t distract from the central theme of the future city developments.
Add demolished buildings
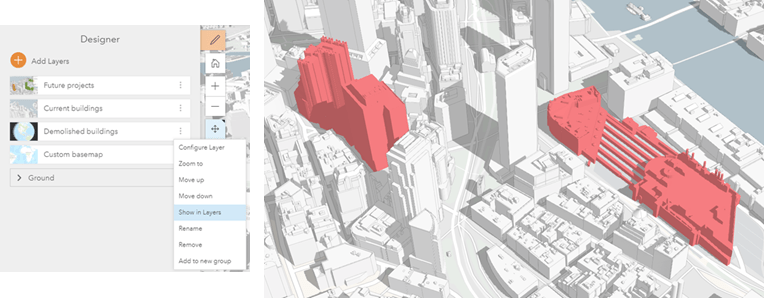
Our scene is looking pretty good. What might be interesting to show is the present buildings that’ll be removed to make way for the new project buildings. You might have noticed the Demolished buildings layer in the Designer layer list. To show these buildings, we simply choose the Show in Layers option in the Demolished buildings layer drop-down and then click the checkbox in the Layers pane to display the layer.
Tip
Hiding layers in the Layers pane is also good practice when there are layers, such as basemaps and thematic layers, that you want visible in a scene, for example our Custom basemap layer.
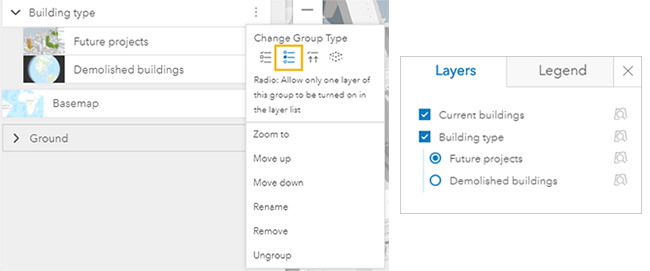
Now that the demolished buildings are visible, you’ll notice that the future projects and demolished buildings overlap. A good way to handle 3D layers overlapping is to make a group layer of the 3D layers. So we group with the Future projects and Demolished buildings layers and apply the Radio Group Type. Now viewers can select one layer at a time to view and compare with each other without any overlap.
Our scene is ready. Now we can further explore the scene with Scene Viewer tools such as Measure, Daylight, or Slides.
As you can see, by using edge styles in your scenes, you can uniquely visualize different building layers and present your ideas more clearly and effectively. You allow your viewers to intuitively gain insights and understanding into the urban concepts and designs you are trying to communicate.
Credits
Boston Planning and Development Agency: http://www.bostonplans.org/3d-data-maps/3d-smart-model/3d-data-download.

Commenting is not enabled for this article.