With ArcGIS Online, individuals, governments, and organizations alike can create and share compelling map stories. For example, by using just two map layers, law enforcement officials could use ArcGIS Online to determine the locations where crimes are occurring, perform spatial analysis to identify crime patterns, and share the results with local residents in an online application.
In this post, I will discuss a practical use of filtering, the ability to limit the display of features on a map, and demonstrate some analysis capabilities now available to ArcGIS Online for organizations. Currently, the ability to perform analysis is a beta release. To be clear, there is no credit cost for performing analysis during this beta period; however, credits are charged for the hosting of the feature services that are the result of an analysis. When the beta program ends, analysis tools will consume credits.
Filtering a layer for specific types of crime
For this example, I have downloaded crime data from the Los Angeles County GIS Data Portal, made available by the Sheriff’s office. I have geocoded the CSV file and shared it as a feature service from ArcMap to ArcGIS Online. This layer, organized by crime type, contains the time and date of each incident as well as addresses at the block level. ArcGIS Online has the ability to filter feature services. Applying filters so only certain crimes, such as arson, display on the map can provide insight into patterns of where arsons are set and help law enforcement officials prevent future attempts. To do so, click the arrow ![]() next to the crime feature layer in the contents window and click Filter.
next to the crime feature layer in the contents window and click Filter.
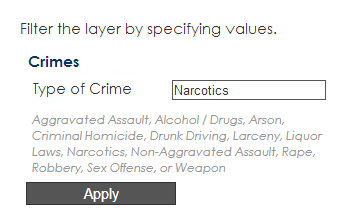
Filters can also be interactive, allowing law enforcement officers to explore the data. To make the filter interactive, check the box and provide a prompt and hint about the available values in the layer. The prompt can be used to ask for a type or category, while the hint can be used to display the possible filters. Prompts and hints will help guide officers toward other filters they might want to apply on the feature layer. To create filter expression for specific crimes, choose the field as ‘Crime’, the operator as ‘is’, and choose a unique crime type.
NOTE: The filter has to be applied to a value, field, or unique type in order to carry over into the filter web map application.
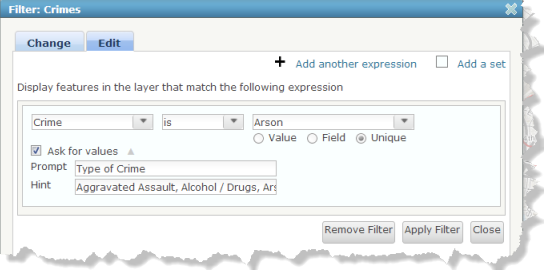
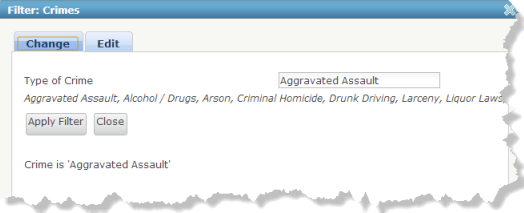
For example, law enforcement officials might set up an interactive filter so other divisions can focus on different crime types, such as aggravated assault or narcotics. By reading the prompt and hint you have entered, officers will know they can type in other crime hints to filter for specific crime types.
Adding a buffer to show crimes near public schools
In the Performing Analysis beta release there are four types of analysis that can enhance the map’s story: aggregate points, find hot spots, overlay layers, and create buffers. Once certain types of crime have been located, it could be important to find crimes potentially harmful to children walking to or from school. One way to illustrate crime proximity to schools is to create a 2,000-foot buffer.
For this example, I have downloaded a points-of-interest dataset from Los Angeles County’s Location Management System, isolated Los Angeles public schools in the dataset, and shared the feature layer from ArcMap to ArcGIS Online. To create a buffer, click the arrow ![]() next to the public schools feature layer in the contents window and click Perform Analysis, Use Proximity, and Create Buffers.
next to the public schools feature layer in the contents window and click Perform Analysis, Use Proximity, and Create Buffers.
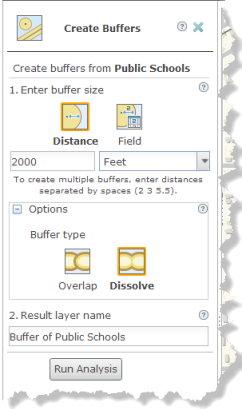
The resulting buffer can help locate the areas of frequent crime and provide insight to law enforcement officials at what time and frequency are children vulnerable to crime.
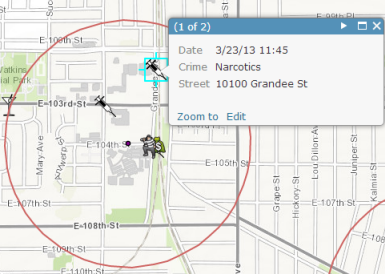
Law enforcement officials can also perform additional analysis with these results; for example, they can find hot spots of crime both within and outside of a buffer. These hot-spot results may provide more insight to crime patterns and help abate their occurrence.
Configuring the filter application template for the public
Web maps are very helpful for illustrating buffers and filters, but law enforcement officials could also configure the filter web map application and share it with local residents. To do so, click the Share button in the map viewer. In the display dialog box, click Make a Web Application, find the Filter application template from the gallery, and click Publish. Next, click go to item page and click Configure the App.
The filter application template will use the filter expressions created in the web map and provide a more interactive experience, where the prompts and hints are always displayed so the map’s users are encouraged to engage with the data.
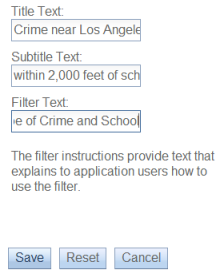
When configuring the app, enter the text of the title, the subtitle text, as well as the filter text. What is entered will display at the top of the application.
 To share the configured web map application, save the text settings and return to the item page in My Content and click Share. A link to the application can now be shared to engage the local residents and raise awareness about types of crime near public schools.
Commenting is not enabled for this article.