When performing spatial analysis, it is a common use case for analysts to apply standardized administrative boundaries, such as countries, states, counties, or places to their data. Geographic boundaries are especially useful to use as layers with spatial aggregation and spatial overlay. For example, you may want to summarize the business’ sales revenue per zip code. Traditionally, the analysts must locate the available and appropriate standard geography dataset for the analysis, in this case the zip code boundaries. This can be a time-consuming process. Often the data is only available from individual government agencies and may come in a variety of formats and in a range of resolutions. Esri’s Living Atlas of the World provides ready to use layers containing boundary and demographic information for different parts of the world. In addition, the data comes from authoritative sources, and contains related local information that GIS analysts can use in their maps, scenes, apps, and feature analysis tools.
For ArcGIS Online spatial analysis tools, we took one step further. We created a collection of Living Atlas Analysis layers, which are optimized for use with online analysis tools. The layers in the Living Atlas Analysis gallery contain more generalized geometries to reduce the required download and processing time. In addition, these layers reside in the same cloud storage hive as the analysis tools therefore they can be quickly accessed for optimized performance. Currently there are more than 600 layers available in the Living Atlas Analysis layers collection, including world countries and other administrative areas, postal codes, various geometric shapes (e.g. hexagons, grids), and the US census tracks and block groups. You can filter the content by map extent, categories, and tags, and search for specific layers to find the data you need for analysis. The Living Atlas Analysis layers are directly integrated into ArcGIS Online spatial analysis tools, making them readily available for use.
Let’s walk through an example. Say you have a CSV file containing a list of houses sold in a city (Figure 1).
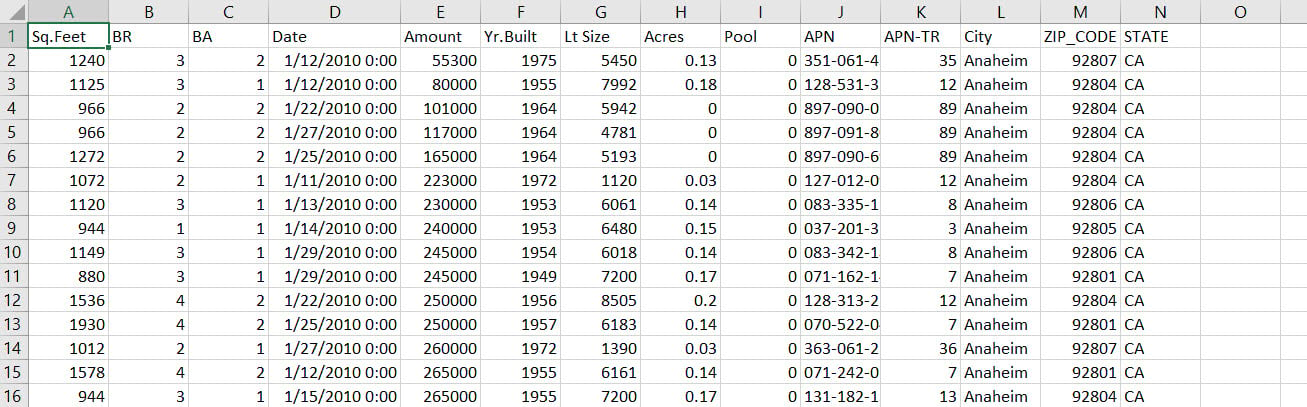
Our goal is to summarize the total number of houses sold for each zip code, and create a choropleth map in ArcGIS Online, which shows the average sales price per zip code. We can do this via the Join Features tool and by accessing the Living Atlas Analysis layers.
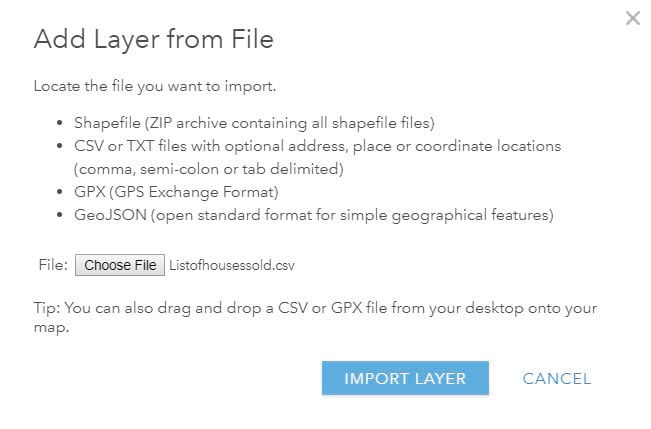
First, sign in to your ArcGIS Online organization. Open the Map Viewer, then add the csv file using Add Data from File option (Figure 2) and add it as a standalone table.
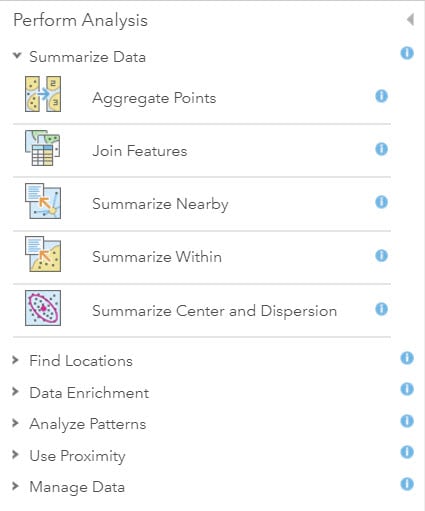
From the Analysis menu, start the Join Features tool under Summarize data (Figure 3).
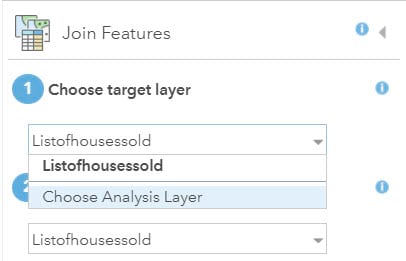
From the Join Features tool, select the “choose analysis layer” option for the target layer (Figure 4).
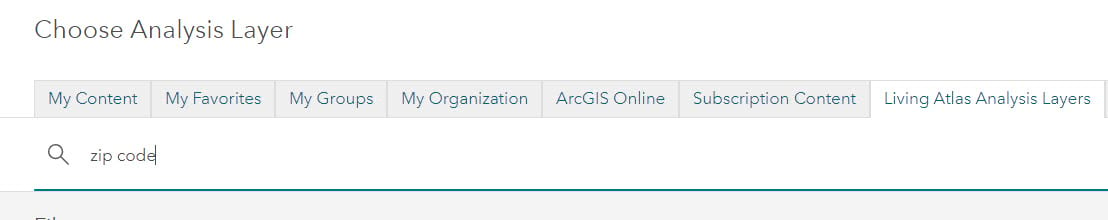
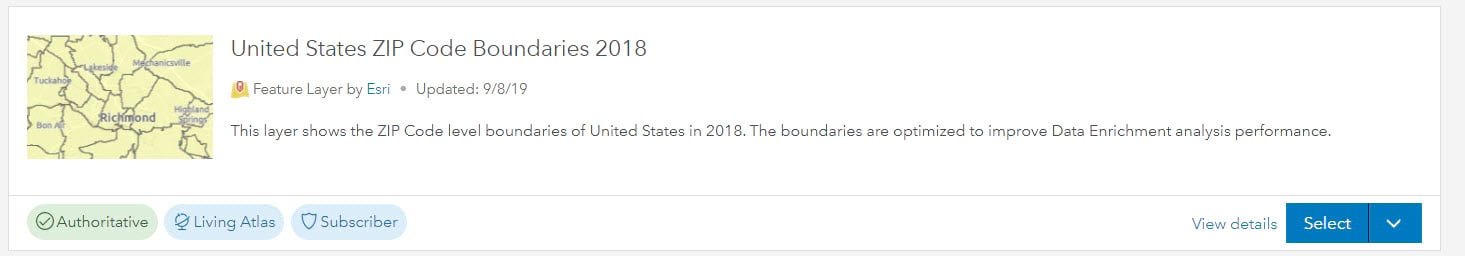
Now you can browse layers to use for the analytical tool. Click the the Living Atlas Analysis Layers tab, search for “zip code” and select the “United States ZIP Code Boundaries 2018” layer from the list of search results (Figure 5).
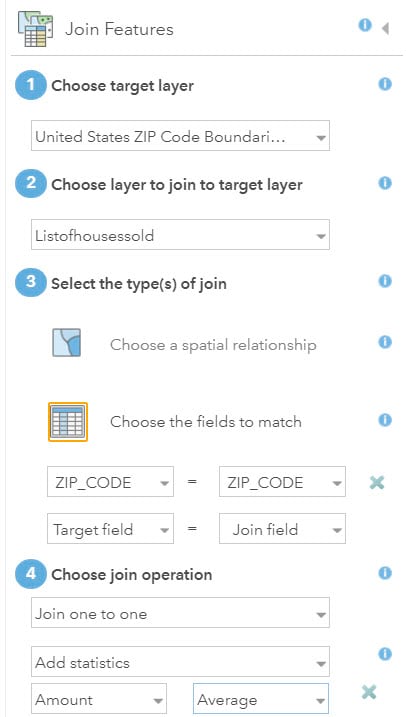
Now I can use the Join Features tool to join my list of houses sold csv file with the US Zip Code boundaries layer based on the common Zip Code field, calculate the total number of houses sold and the average sales price for each zip code in my study area. (Figure 6).
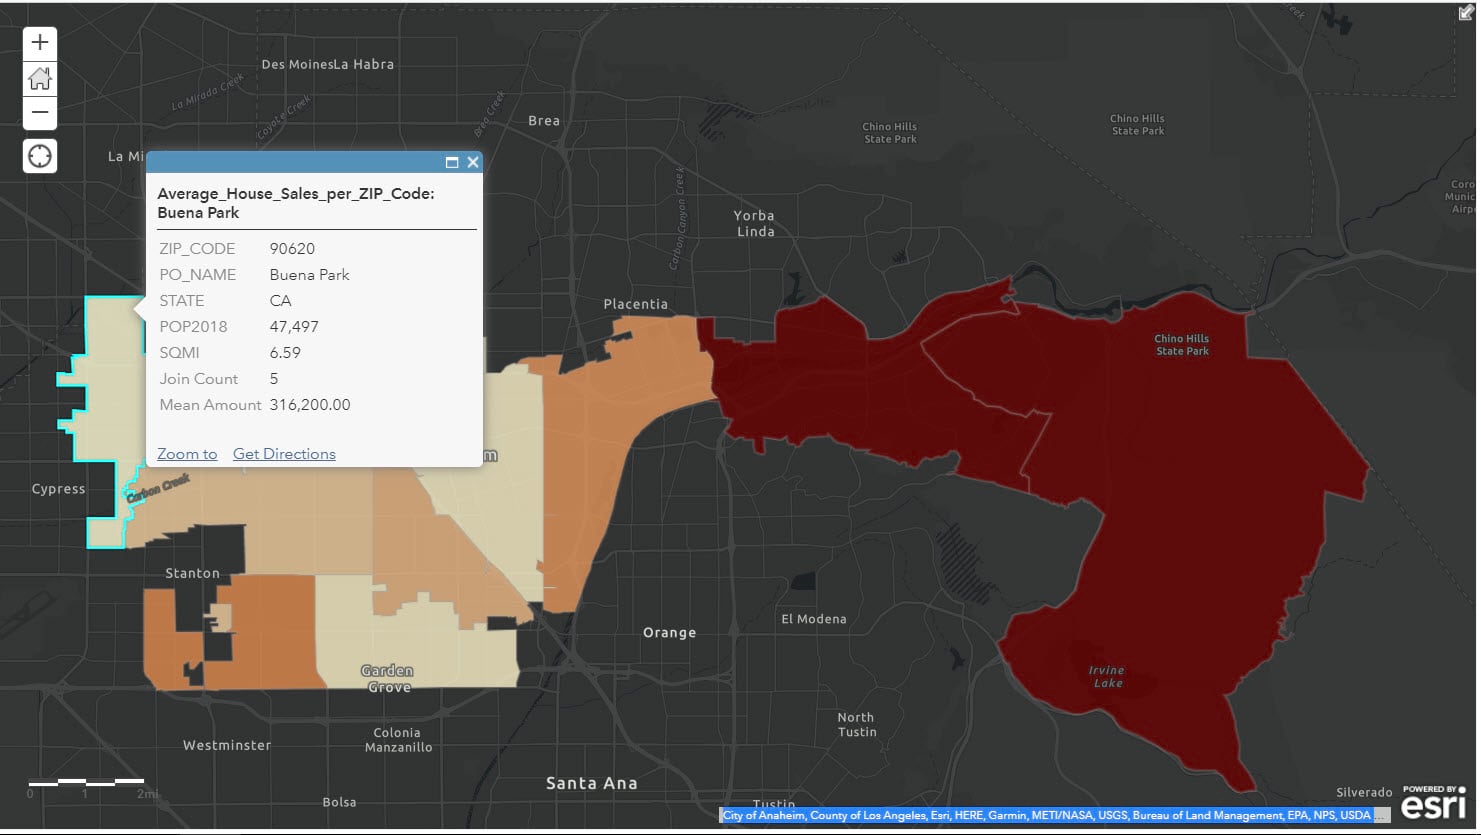
From the result layer generated by the Join Features analysis, we can make a choropleth map showing the average sales price per zip code (Figure 7).
So if you are using ArcGIS Online spatial analysis tools, and are in need of standard geography boundaries, please make sure to check the Living Atlas Analysis layers first.
What if you would like to have your own analysis layers collection? Perhaps you would like to have the ability to define a custom group containing layers that should be used for analysis in your organization? In ArcGIS Online, you can create your own analysis layers gallery (Figure 8).
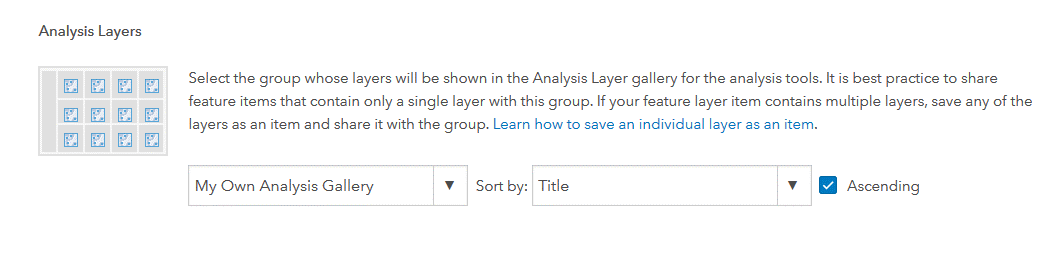
The layers in the custom group can come from different sources, such as features published directly to your organization, layers shared from other organizations, and Living Atlas Analysis layers.
To sum up, Living Atlas Analysis layers include standardized geography content from the Living Atlas of the World that are optimized for use with ArcGIS Online spatial analysis tools. They are integrated with online analysis workflows and ready-to-use. You can also create your own custom analysis layers group which can include selected Living Atlas Analysis layers.

Commenting is not enabled for this article.