Complex global geometries can sometimes be slow to draw in web apps, especially if the data includes multiple countries with islands, long coastlines, and jagged boundaries. Make tile layers your operational layer type of choice to optimize drawing performance of complex geometries at small scales. Tile layers support fast visualization of large datasets using a collection of pre-created map images or tiles. This blog covers how to identify slow-drawing geometry in operational layers and some tips and tricks for using hosted tile layers.
Identify geometry that causes maps to draw slowly
ArcGIS Online web apps request spatial and attribute information from operational layers (web services) to display and visualize data in the application. The speed in which the data is displayed in the application is determined by the request and response time. A large amount of information, (size), in a response will result in a slower response time than a small amount of information. As an example, click on this link and take note of how long it takes for the operational layer to load. It should take about 1-3 seconds which isn’t a great experience for users. The countries layer in the app uses a hosted feature layer as an operational layer. The response from a feature layer request contains geometry, x and y information for each vertex or point and attribute information. To determine if the size of the response from a request is resulting in a slow response time, calculate the number of vertices and the number of attributes for your dataset. Read this Geonet Blog for more information on monitoring web requests.
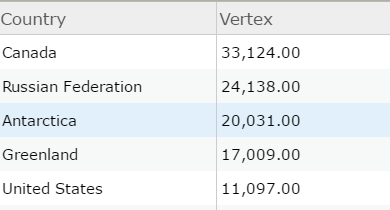
To determine the complexity of the geometry in this dataset, the vertices for each country were calculated as a new field in ArcGIS Pro prior to publishing the feature layer to ArcGIS Online. Overall there are 237,604 vertices, with 5 countries making up for 45% of the vertices, resulting in a response size of 1.2 MB.
As generalizing the geometry or eliminating Canada, Russia, Greenland and the United States won’t accurately visualize the global data in the dataset, and users don’t want to have to wait for the initial layer to draw, the next tips will show how to best use a hosted tile service to improve the drawing speed of the application, by minimizing the response size.
Tip 1: Create a hosted tile layer from a hosted feature layer
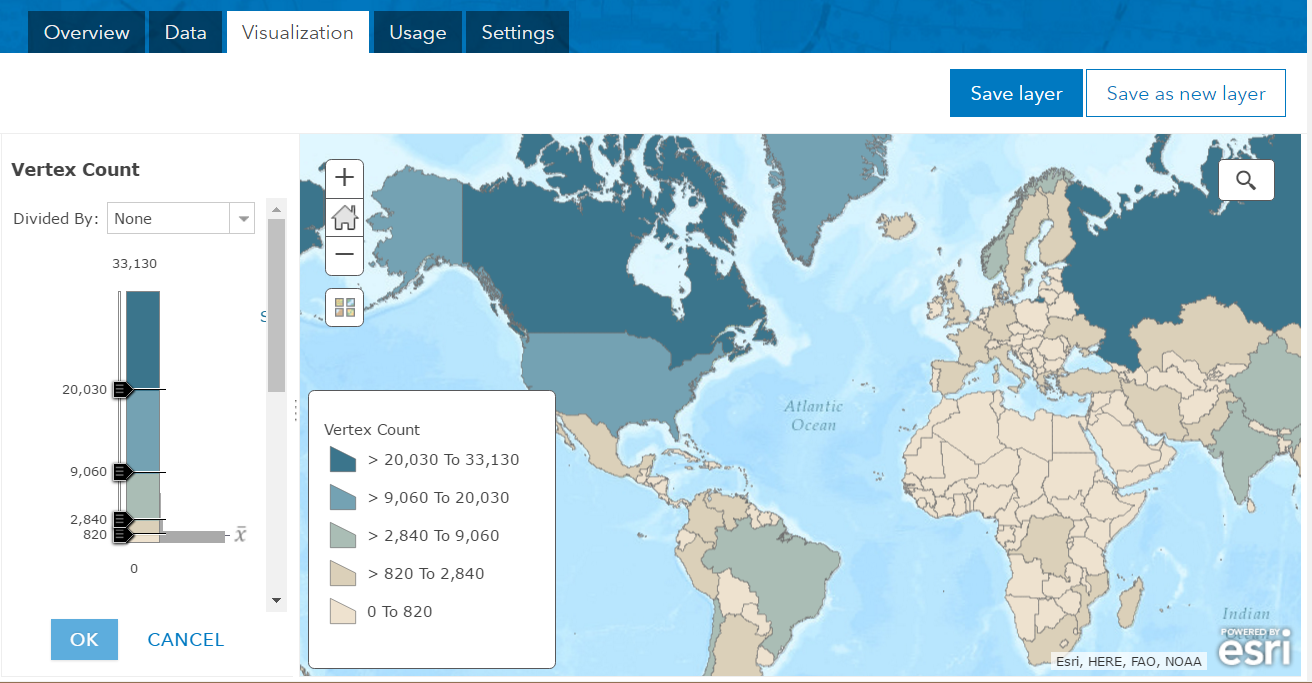
Within ArcGIS Online, open the item page of your hosted feature layer and go to the Visualization tab. Choose your desired symbology for your tile layer by changing the style on the feature layer and select Save Layer.
Select Publish> Tile Layer from the Overview tab

Ensure that display with ArcGIS Online is selected. This parameter determines the tiling scheme that will be used for the tile layer, which needs to match the basemap. Selecting ArcGIS Online basemaps ensures that the tile layer will have a tiling scheme that matches the ArcGIS Online basemaps.
When you publish a hosted tile layer from a hosted feature layer, a relationship between the two items is established. This allows the application to query attributes from the feature layer while using the tile layer for visualization.
Tip 2: Build only the tiles that you need to improve drawing speed at specific scales
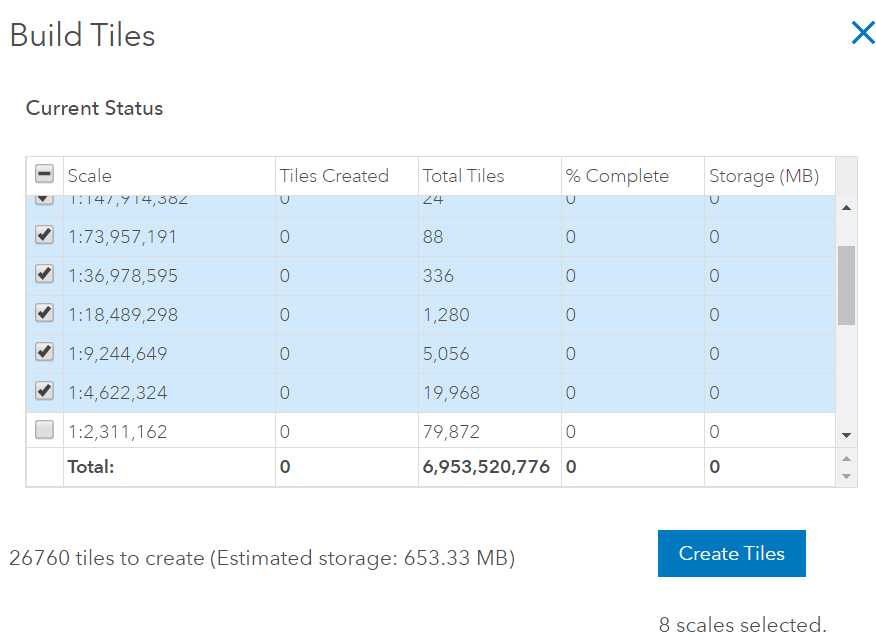
As the large response sizes are resulting from requests of the entire dataset at a small scale, the performance will improve when the data is displayed at a smaller scale with tiles. For this reason, only create tiles at the smallest scales and use the feature layer as the operational layer at large scales.
For this example, build the top 8 scale levels, creating 26,760 tiles, costing 26.76 credits.
Tip 3. Enable pop-ups on your hosted tile layer
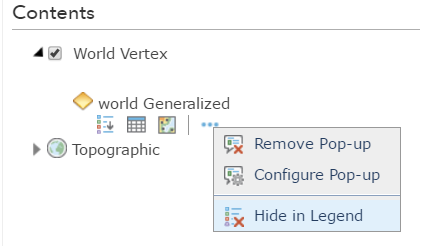
Once the tiles have created, open the tile layer in Map Viewer and enable pop-ups. As this tile layer was created from a hosted feature layer, the pop-up is already configured to refer to the feature layer for attribute data.

Configure the pop-up to display your desired data. If it was configured for the hosted feature layer, the same settings will be applied. Click this link for tips on configuring pop-ups.
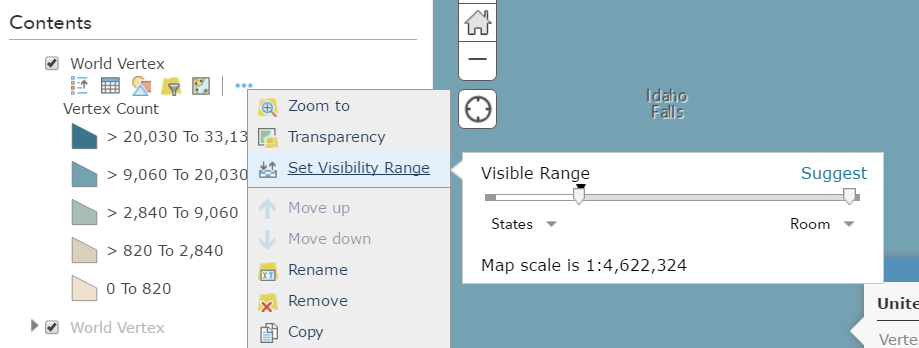
Tip 4. Set the scale visibility on the tile layer and feature layer so they display when needed
As tiles were created for the eight smallest scales in tip 2, add the original hosted feature layer to the same web map so that there is data that will be displayed at the largest scale.
Once both the tile and feature layer are added to Map Viewer, turn off the top layer (feature layer), by unchecking the check box. Zoom slowly until the tile layer doesn’t draw then zoom out one level. Set the visible scale range so that the tile layer can be viewed from the world range to the current visible tiles:

Zoom in one level so the tile layer disappears and unclick the content check box on the tile layer (the second layer in Contents). Check the feature layer check box and repeat the step to set the scale visibility so the feature layer is visible from the current scale to the largest scale.
Zoom in and out to ensure that both layers are not turned on at the same time and that there is a seamless transition from feature layer to tile layer.
Create an app from your web map and bask in the superb performance that you have just created using best practices with tile layers. The response size of the request to the operational layer (tile layer) was 150 KB, where the feature layer response was 1.2MB.
Now compare the initial load performance of the following apps:
Operational Layer : Tile Layer
Operational Layer: Feature Layer
Operational Layer: Tile and Feature Layer with scale dependency

Article Discussion: