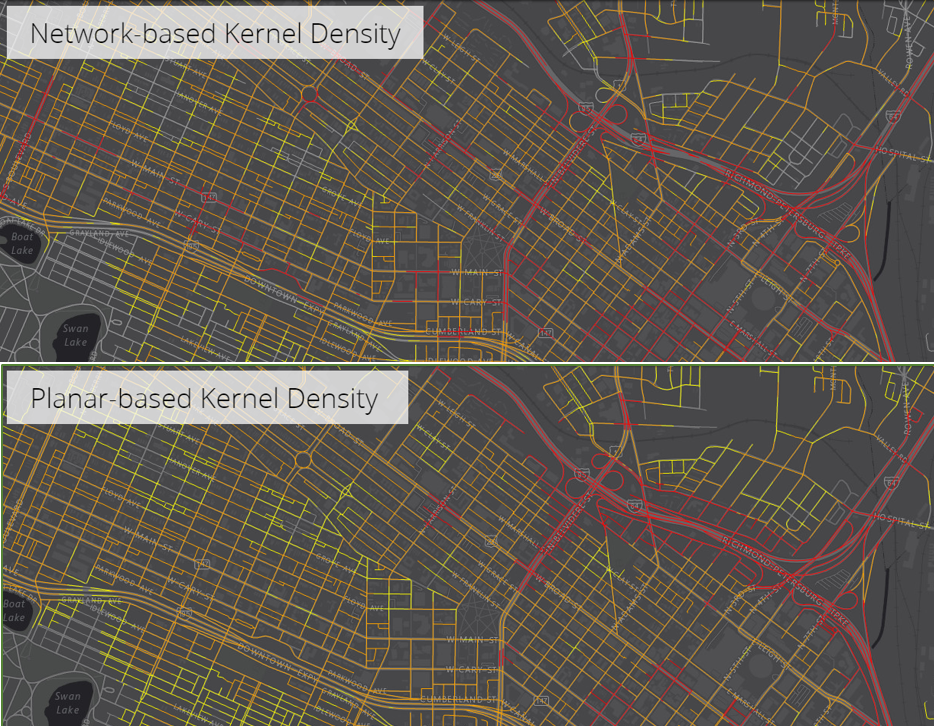
Check out this Story Map on a spatial data exploratory analysis of vehicle crashes in Richmond City, Virginia that identifies hazardous road segments (hotspots) using both Network Kernel Density Estimation (KDE) and Planar KDE methods for eight different bandwidths.
The analysis includes a data description showing the spatial and temporal distributions of two types of crashes analyzed in this study: speed-related crashes and alcohol-related crashes, and compares the performance of both the methods for finding hotspots of vehicle crashes. Finally, the workflow answers the question: how similar are the results from the planar spatial analysis method to those from the network spatial analysis method?
This comparison can help you choose the density method you want to use for your analysis to improve road safety planning measures.
This analysis and Story Map was created by Ehsanali Keshteh Gar during his summer internship with the Spatial Analyst Team in summer 2017. Ehsanali is currently pursuing his PhD in Geospatial Engineering and MS in Transportation Engineering at Virginia Tech. His research interest is using Network Spatial Analysis to solve transportation problems. For additional questions, you can comment here or contact him at ekeshte@vt.edu.

Article Discussion: