Approximate Reading Time: 8 minutes
In ArcGIS Pro 3.1, the Generate Tessellation tool can now create hexagon grids using the open-source hierarchical spatial indexing system, H3. H3 hexagons were first introduced in ArcGIS Pro 3.0 by the Business Analyst team as an option for the licensed Generate Grids and Hexagons tool. Now, H3 hexagons are also available in the core Generate Tessellation geoprocessing tool!
Generate Tessellation tool
The Generate Tessellation tool creates a grid of repeating shapes over a given area. In previous versions of ArcGIS Pro, the tessellated shapes included triangles, squares, diamonds, hexagons (flat-top), and transverse hexagons (pointy-top). In ArcGIS Pro 3.1, the Generate Tessellation tool continues to offer all the same tessellation shapes, with the addition of H3 Hexagons.
H3 hexagons are available in the Shape Type parameter’s drop-down list. You can set the average area of each H3 hexagon in the H3 Resolution parameter, where you can choose between 16 precomputed H3 resolutions (0 through 15). The bigger the resolution, the smaller the average area is for each hexagon—this results in more hexagons covering the same area.

If you are unfamiliar with H3 hexagons, this blog will briefly introduce them. If you are already familiar with H3 Hexagons, keep reading to see how to use H3 hexagons for spatial analysis.
What is H3?
H3 is a hierarchical indexing system developed by Uber that uses hexagons to tile the Earth’s surface. H3 builds its grid of hexagons over an icosahedron: a shape with 20 triangular faces and 12 vertices. Since it is impossible to tile an icosahedron with only hexagons, each resolution needs 12 pentagons to complete the grid. A hierarchical indexing grid means each hexagon can subdivide into sub-unit hexagons. Therefore, H3 can index any location on Earth, starting from an average area of 4,357,449.41 km² (resolution 0) down to 0.895 m² (resolution 15).

H3 has been written about in detail in other places, including the H3 documentation. But you might be asking, why should I care about a new type of hexagon grid?
Why use H3 Hexagons for Spatial Analysis?
Spatial binning or aggregation is an excellent way to analyze patterns in large point datasets. There are several advantages to using hexagonal grids for aggregation and summarization rather than administrative boundaries like states, counties, or block groups.
Using a uniform grid of hexagons, you can display raw count statistics. Administrative boundaries are irregular in size and shape, which may cause size bias where larger objects appear more prominent and require normalization for numeric attributes. Also, unlike administrative boundaries, hexagons do not change over time, meaning you can use them to compare data over different time horizons. In particular, H3 hexagons are great because they are built over a model of the Earth, meaning their position remains consistent at each resolution. Therefore, you can use H3 hexagons as a standardized grid across multiple scales of analyses and projects.

Lean more about the advantages of hexagon grids in spatial analysis.
Example: Analyzing tornado data using H3 hexagons
This example uses the initial point locations of tornadoes from 1950 to 2021 available on the National Weather Service SVRGIS page. The data includes each tornado’s start and end location, the year it occurred, and the estimated property loss (in millions of dollars).
| OBJECTID | year | property loss | start lat. | start long. | end lat. | end long. |
|---|---|---|---|---|---|---|
| 1 | 1950 | 4 | 36.73 | -102.52 | 36.88 | -102.3 |
| 2 | 1950 | 5 | 34.17 | -78.6 | 34.1701 | -78.59989 |
| 3 | 1950 | 5 | 37.37 | -87.2 | 37.3701 | -87.1999 |
Our goal is to visualize the impact of tornadoes from the last decade (2011 to 2021) over the lower 48 United States.
Create a grid of H3 Hexagons using the Generate Tessellation tool
Using the Generate Tessellation tool, set the following parameters:
(1) Specify the Output Feature Class as memory\h3_hexagons.
Note: Because this step is intermediate, writing data to memory provides the fastest performance by creating a temporary hexagon layer.
(2) Position your map over the lower 48 states, then set Extent to Current Display Extent.
Note: This will populate the extent coordinate boxes with your map’s current min and max X/ Y coordinates.
(3) Specify the Shape Type as H3 hexagon
(4) Set the H3 Resolution to 4
(5) Specify the desired Spatial Reference.
Note: We used the Equal Earth Americas projection to minimize area distortion. Using a UTM or State Plane projected coordinate system would be inappropriate for a large continental area grid. Also, you should avoid generating a large grid using Web Mercator.

Run the Generate Tessellation tool.
The resulting feature class contains a grid of H3 hexagons with an H3 Resolution of 4. The average area of each hexagon is roughly 1,770.3 square kilometers, where some of the hexagons are smaller or larger than this average size.

Select only the hexagons that intersect the United States
Notice that the tool’s output is a large grid covering the whole map extent.
For this example, we want to limit our area of interest to the lower 48 United States:
Using Select by Location  set the following parameters:
(1) Set Input Features as h3_hexagon
(2) Set Relationship to intersect
(3) Copy and paste the following URL for the Selecting Features: https://services.arcgis.com/P3ePLMYs2RVChkJx/arcgis/rest/services/USA_Boundaries_2021/FeatureServer/0
Note: This is a feature layer of USA Boundaries from the ArcGIS Living Atlas; you can use the feature service path as inputs to geoprocessing tools.
(4) Check Invert Spatial Relationship to select all hexagons that do NOT intersect the USA.

(5) Use the Delete Features tool to remove all selected features from the H3_hexagon layer

Summarize the tornadoes within each H3 hexagon
Lastly, we will use the Summarize Within tool:
(1) For Input Polygons, choose the H3 hexagon layer of the United States
(2) Set Input Summary Features as the tornado layer
Note: the tip indicates a filter is applied to the layer. We applied a Definition Query to use only tornadoes where the year > = 2011
(3) Specify the Output Feature Class
(4) Under Summary Fields, use property loss for the Field and sum for the Statistic
(5) Leave Keep all input polygons checked
(6) Leave Add shape summary attributes checked to include a count of the number of points in each hexagon.

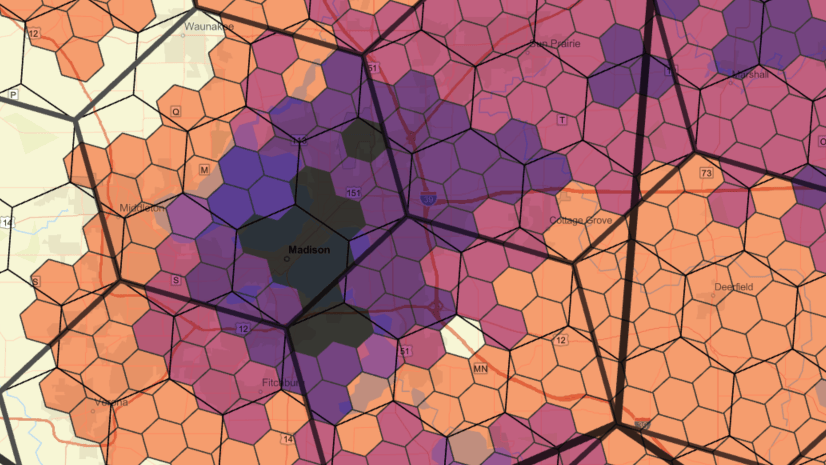
After running the Summarize Within tool, the resulting feature class will include the following:
(1) The raw counts of tornadoes per H3 hexagon

(2) The total estimated property damage per H3 hexagon.

Summary
H3 is a hexagonal hierarchical spatial indexing system developed by Uber. In ArcGIS Pro 3.1, H3 hexagons are available in the Generate Tessellation geoprocessing tool. This tool creates a uniform grid of repeating shapes over any given area. You can use H3 hexagons as a standard grid for visualizing and comparing spatial patterns across multiple scales of analysis and locations. We hope you try using H3 hexagons in your next project!
Sources
- Sahr, k., (2011). HEXAGONAL DISCRETE GLOBAL GRID SYSTEMS FOR GEOSPATIAL COMPUTING. Archives of Photogrammetry, Cartography and Remote Sensing, Vol. 22, pp. 363-376.
- Uber Engineering. (2018, November 19). [Uber Open Summit 2018] Hierarchical Hexagons in Depth. [Video]. Youtube. https://www.youtube.com/watch?v=UILoSqvIM2w
- Uber Technologies, Inc. (n.d.). H3. Retrieved February 10, 2023, from https://h3geo.org/

Article Discussion: