Classification (or thematic) maps are powerful tools that can be used for a wide variety of analyses. From land cover to demographics, we can look at change through time and learn about the world around us.
If you have ever worked with a classified map, you may have wondered if there was an easy way to compute this change from one time to another. Now with ArcGIS Pro 2.6, you can do this with the click of a button.
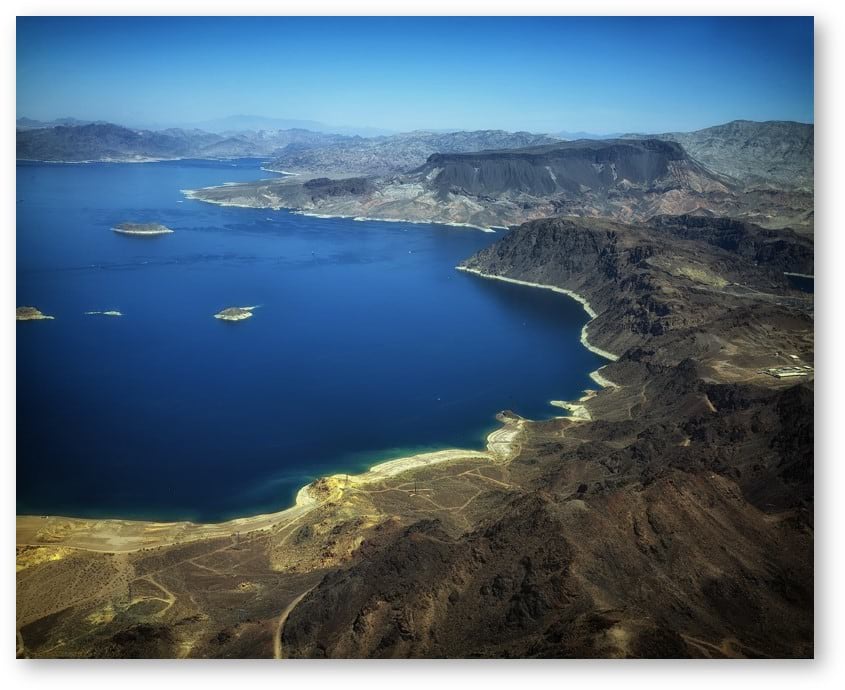
Lake Mead – the primary water reservoir created by the Hoover Dam – is a vital water resource for communities in Nevada, Arizona, and California, including the nearby city of Las Vegas, Nevada. Although it is one of the largest water reservoirs in the United States, the water level at Lake Mead has been steadily dropping since 2001 due to extended droughts and increased demands on water resources from population growth. Imagery and remote sensing data can be used to observe and monitor this critical water resource, including quantifying change through time.

The process is rather simple. It includes selecting your imagery, computing a categorical change map showing all land cover changes, and lastly remapping the results to visualize change in water levels.
Step 1: Selecting the imagery
In this example, we will use the National Land Cover Database (NLCD) image service, which provides several years of land cover classification maps. This dataset is available on ArcGIS Living Atlas of the World and accessible as an image service for viewing and analysis in ArcGIS Pro. The NLCD includes several years of data, but for this analysis we only need two years to calculate the change. We can use the Raster Item Explorer to extract the classification maps for 2001 (the year of Lake Mead’s peak water level) and 2016 (the most recent classification available through the NLCD).
Step 2: Compute categorical change map showing all land cover changes
Now that we have extracted the 2001 and 2016 NLCD classification maps and added them to our ArcGIS Pro project, we can use raster functions to complete our analysis. Raster functions process your data on demand, allowing for rapid experimentation and analysis. New with ArcGIS Pro 2.6 is the Compute Change raster function, which will identify categorical changes in classification maps between two times.

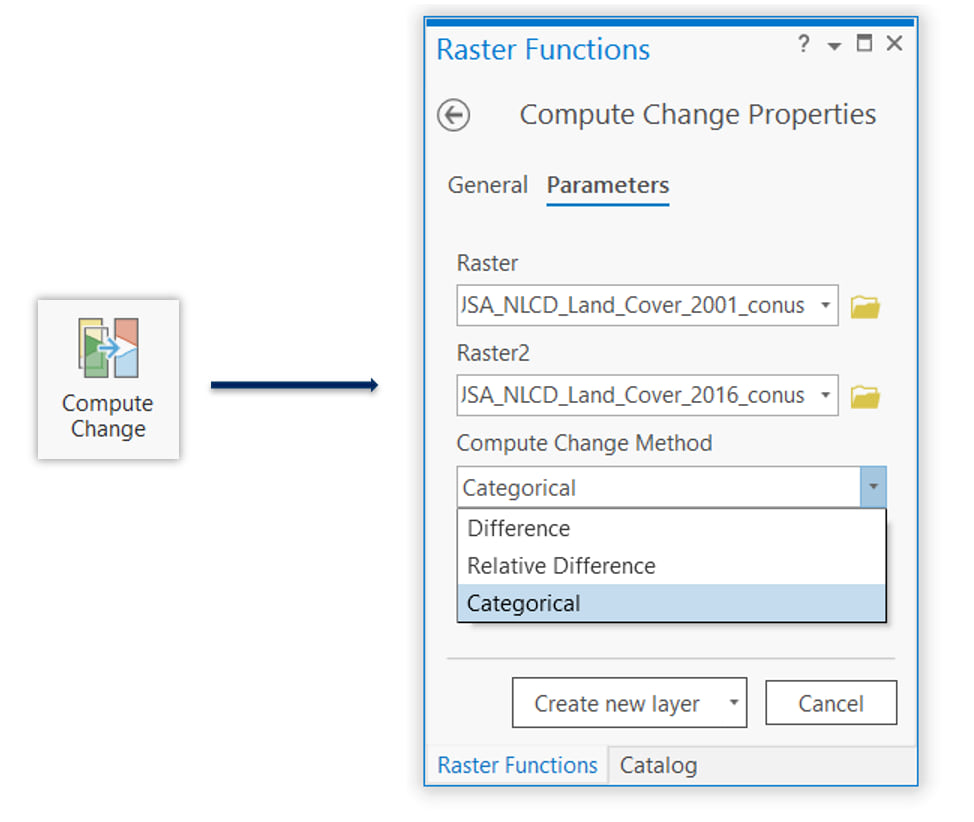
In the raster functions menu, we will select the Compute Change raster function (listed in the Analysis group) and enter the following
- Raster = 2001
- Raster1 = 2016
- Compute Change Method = Categorical
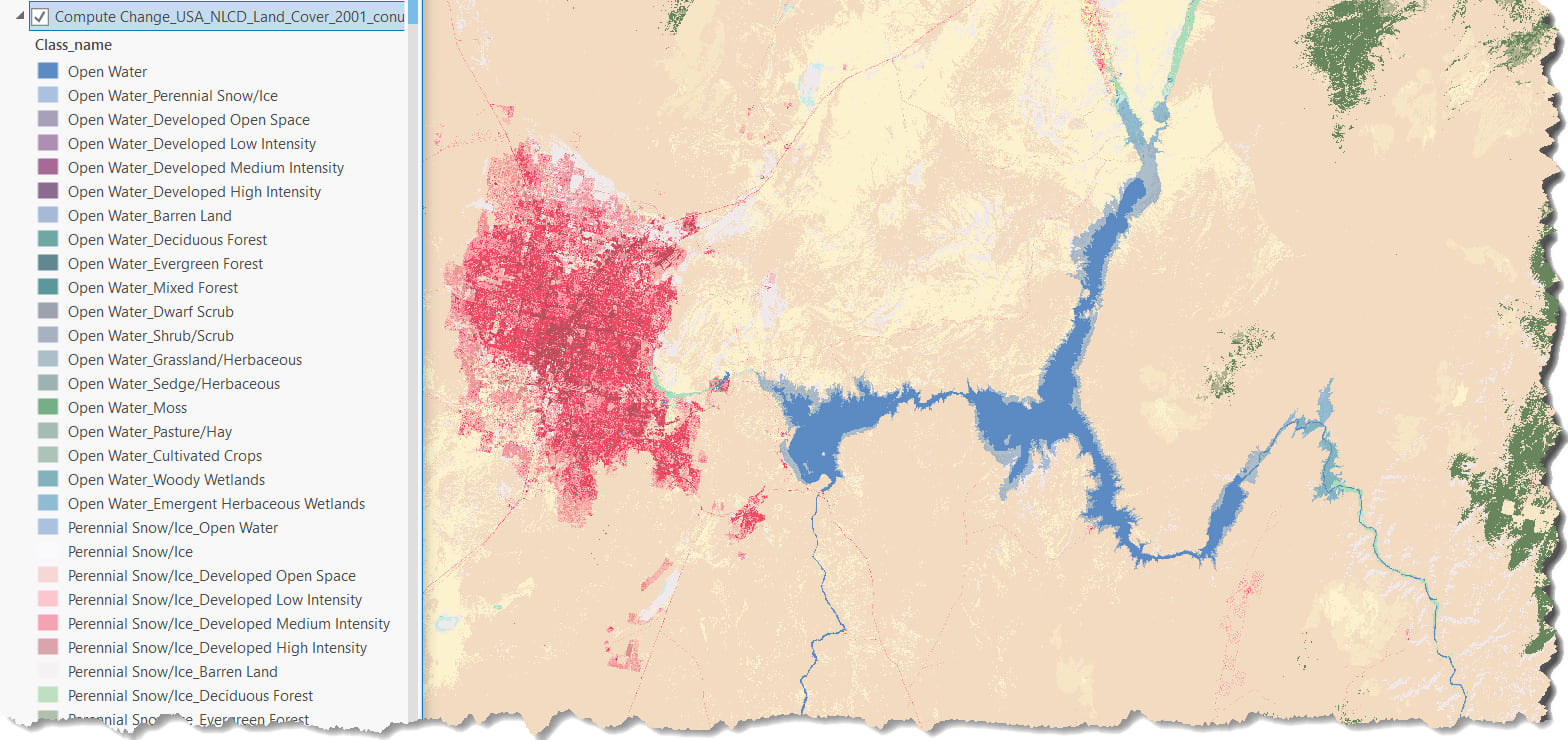
The output is a categorical change map that shows every possible land cover class transition between the 2 dates.

Step 3: Remap data to visualize change in water levels
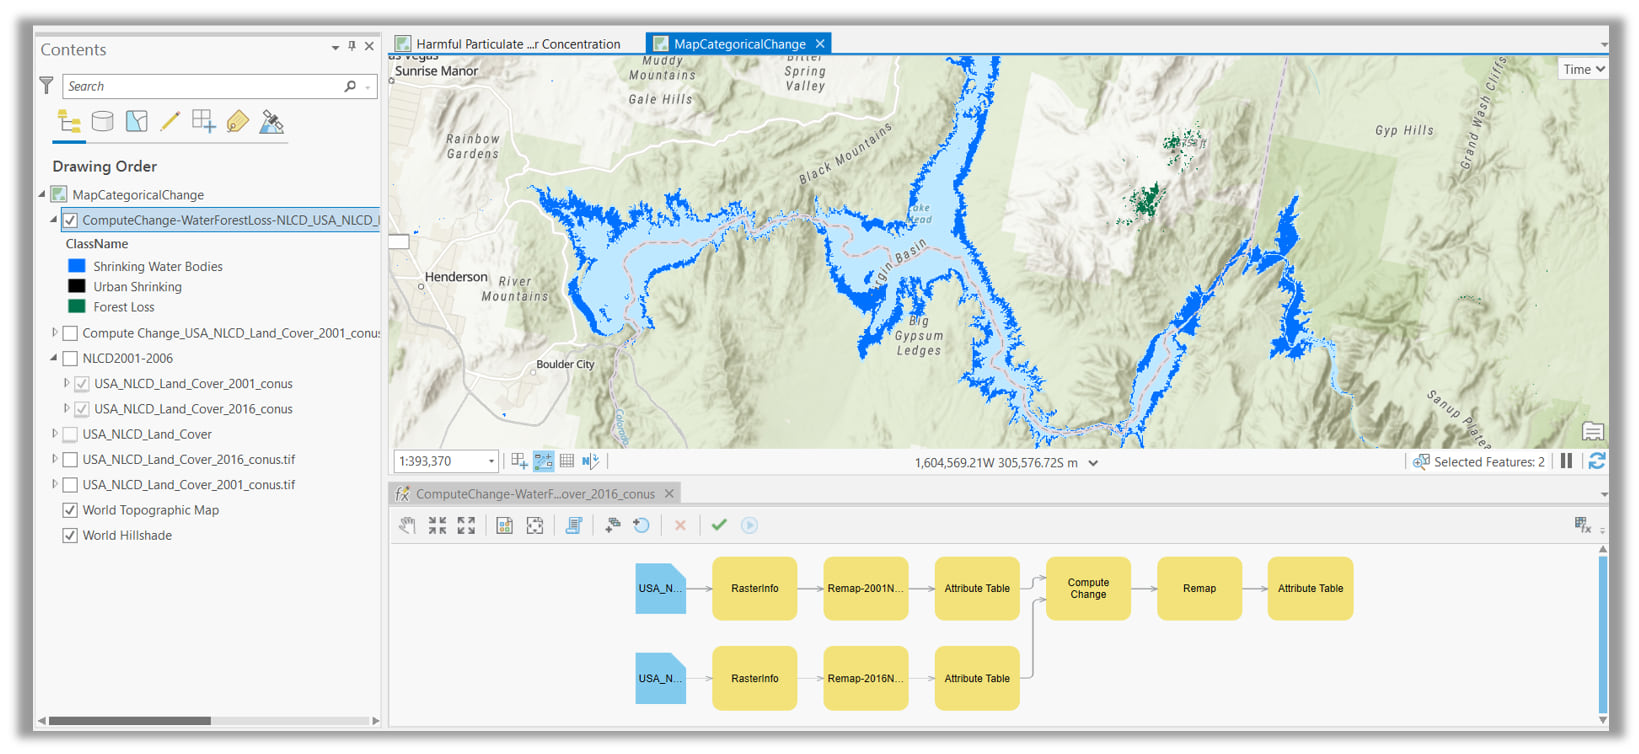
Next, we can use this change raster to visualize and/or quantify the amount of lake area that has disappeared from 2001 to 2016 by using the Remap raster function in the Lake Mead region. To do this, we will remap only the areas that have changed from open water to something else (dry land) to one class. We can then calculate the size of this area around Lake Mead which has changed from open water to dry land.

Using these few simple analysis tools, we are able to calculate the area around Lake Mead which has changed from open water to dry land during the period of 2001 to 2016. Analyses like these can be used to monitor environmental changes (like those occurring at Lake Mead) and other natural resources, characterize demographic changes, agricultural changes, and monitor the spread of urban centers. Identifying and visualizing changes in classification maps is now easier than ever and can be done on the fly with rapid and powerful raster function tools.


Article Discussion: