There is a pressing need to ensure access to clean water and sanitation—firmly recognized as a fundamental human right—is available to vulnerable populations in the Rohingya refugee camps, the world’s largest refugee settlement located in the Cox’s Bazar district in Bangladesh.
At the Developer Summit 2022 plenary, Ling Tang leveraged the power of deep learning to identify what percent of people in a subset of the Rohingya refugee camps lack access to a washroom within a 2.5-minute walk, which can help optimize facility allocation to better address the growing water and sanitation needs in the settlement.
Watch the plenary video below, and then read the rest of the blog for a summary of the processes that Ling Tang explored in her demo.
Extract shelter footprints
First, Ling Tang used the Detect Objects Using Deep Learning tool—one of the many tools in the Image Analyst toolbox that facilitate deep learning workflows—in conjunction with the Building Footprint Extraction model hosted by the Living Atlas to automate the time-consuming and labor-intensive task of digitizing building footprints. This resulted in the detection of over 4000 structures in the high-resolution drone imagery of the camp provided by the International Organization for Migration (IOM). In the map, the blue features represent the detected buildings.

However, footprints of tents sprawled across the camp were not extracted by the pretrained model. To extract these missing footprints, Ling Tang first used the Label Objects for Deep Learning tool to capture samples and digitize a training dataset. Next, she generated a folder of image chips from the training dataset using the Export Training Data for Deep Learning tool.

She then used the image chips to train a new model using the Train Deep Learning Model tool. The pretrained Building Footprint Extraction model was used to fine-tune the new model, which converged to a high precision score of 85%. Finally, she used the Detect Objects Using Deep Learning tool again, but this time in conjunction with the newly trained model to detect an additional 3000 structures. In the map, red features represent the newly detected structures.

Evaluate washroom access
After learning where and how big the tents are within the camp, Ling Tang estimated the population by using a population density of 1 person per 6 square meters, a statistic provided by the United Nations High Commissioner for Refugees (UNHCR).

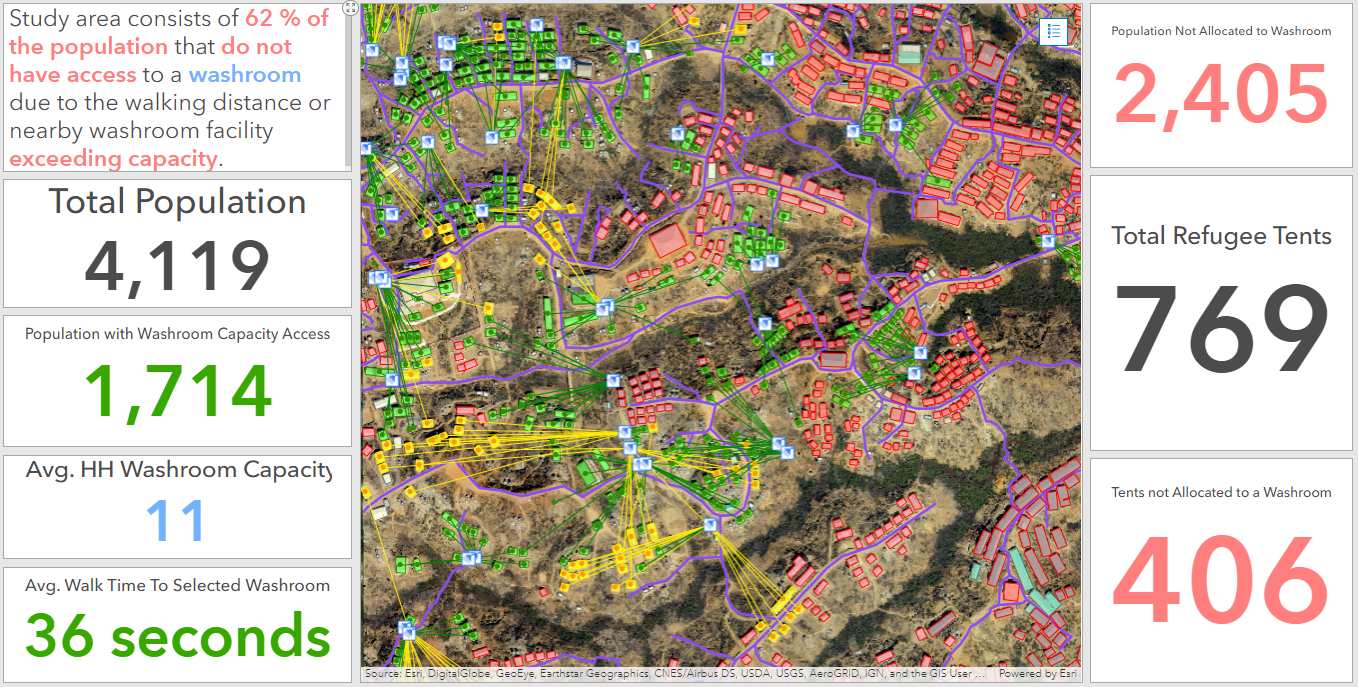
Next, she leveraged network analysis tools and network dataset to allocate tents to washrooms based on population, walking distance, and washroom capacity. In the map, green and yellow features represent shelters within a minute’s and up to 2.5 minutes’ walk to a washroom, respectively; and black lines represent walking paths. Red features denote tents that could not be allocated to a washroom because the nearby washrooms are either over a 2.5-minute walk or exceeding capacity.

Finally, Ling Tang showed how high-level information can be conveyed in an intuitive, interactive, and comprehensive manner through a dashboard. The dashboard she created distinctly highlights critical information, such as the percentage of the population in the study area that lacks access to a washroom within a 2.5-minute walk.

Learn more
Ling Tang’s demo showed how deep learning tools can be used to extract meaningful information such as access to basic water and sanitation facilities in refugee camps, which can help humanitarian agencies tailor their response more effectively. Visit the ArcGIS Pro documentation to learn more about how you can leverage the power of deep learning to facilitate your GIS work.


Commenting is not enabled for this article.