Reducing crime is a local law enforcement agency’s most fundamental mission. To reduce crime, many agencies employ a version of New York City Police Department’s CompStat process. This process uses statistical analysis to identify where problems are emerging so they can respond before the problem gets out of hand. To effectively allocate resources, law enforcement agencies want to use current data and statistics to identify trends and make this information available to police executives so they can make informed decisions faster.

Many organizations, however, struggle to implement Compstat successfully, imposing significant burdens on staff time and yielding limited crime reduction benefits. To create the Crime Reduction Statistics solution, Esri worked closely with existing users to understand the challenges facing agencies using a CompStat-style process for crime reduction. As we developed this solution, we heard four common themes:
- Statistics without context cannot not identify actionable problems or drive effective responses. Effective agencies drill-down into the details of incidents that make up a statistical change so they can plan responses that are appropriate for the specific nature of the problem.
- Chasing percent change increases without understanding seasonality and natural historical variance results in misallocated resources. At Compstat meetings, district captains are expected to be held accountable for conditions within their area. This creates an expectation that any percent change increase displayed on a statistical report requires a response, however, these increases are often normal seasonal variation. With limited resources for proactive work, effective organizations compare current conditions against historical norms to discover true spikes in crime and disorder.
- Hard-copy statistics age too rapidly for modern data-driven decision-making. A key feature of every Compstat process is a briefing book- a thick binder full of hard-copy statistical reports used to share information. In an age of real-time data and rapidly changing crime and disorder environment, the hardcopy statistics in the briefing book are insufficiently agile to support the operational decision support needs of modern police leaders.
- Labor-intensive manual mapping and statistics-generation processes consume time better spent on meaningful analyses. Agencies often struggle with the level of personnel time required to support CompStat. Effective agencies automate these processes, so analysts can do real analytical work to help decision-makers understand and address problems.
To help organizations modernize their Compstat program, the Crime Reduction Statistics solution delivers a set of capabilities that help law enforcement agencies manage incident data, generate key statistics and reports, and monitor trends in crime.
Accelerate the identification and location of statistical trends
The Crime Statistics Dashboard is used by police personnel to interactively map and monitor short- and long-term statistical trends and spikes in crime which helps personnel quickly identify and respond to emerging crime problems.
The app displays statistics for category groupings based on the National Incident-Based Reporting System (NIBRS) standard for crime reporting. By default, the app displays agency-wide statistics, but you can filter to view stats and incident maps for any administrative area in your agency. The app displays statistics for the current 28-day and 365-day period, showing current and previous totals, percent change, and the three-year average for the period, as well as a spike detector metric (using poisson z-scores) that shows when the current period is significantly higher than the three-year average. All statistics are color-coded for ease of use.
Statistics can also be viewed by major crime category or crime type, and can be downloaded as comma separated value (CSV) files. All tables are fully interactive with the map. Incident details can be viewed on the Crimes tab, and can be filtered further using interactive charts. Any subset of data can be downloaded to CSV.
To quickly gain an understanding of problem severity, the app also includes top 10 lists for the 28-day and 365-day period. For all combinations of administrative area and crime type, the top 10 lists show the greatest percent change increases and spikes for the statistical period. The lists are also fully interactive with the map and incident details on the Crimes tab.
Calls For Service Statistics Dashboard is used by police personnel to interactively map and monitor short- and long-term statistical trends and spikes in calls for service, which helps personnel quickly identify and respond to emerging disorder and service problems. The app displays statistics for call volumes and median response times for the last 28 days, last 365 days, by month and by priority. By default, the app displays agency-wide statistics, but you can filter to view stats and incident maps for any administrative area in your agency.
Like Crime Statistics Dashboard, The app displays statistics for the current 28-day and 365-day period, showing current and previous totals, percent change, and the three-year average for the period, as well as a spike detector metric (using poisson z-scores) that shows when the current period is significantly higher than the three-year average. Statistics and response times can also be viewed by call type, and can be downloaded as comma separated value (CSV) files. All tables are fully interactive with the map. Incident details can be viewed on the Calls tab, and can be filtered further using interactive charts. Any subset of data can be downloaded to CSV.
Calls For Service Dashboard also includes top 10 lists for the 28-day and 365-day period. For all combinations of administrative area and call type, the top 10 lists show the greatest percent change increases and spikes for the statistical period. The lists are also fully interactive with the map and incident details on the Calls tab.

Streamline preparation of crime and call statistics
The Crime Reduction Statistics solution also includes the Law Enforcement Data Management ArcGIS Pro project. It can be used by crime analysts to automate data imports from records management or computer-aided dispatch systems. The project includes guided task workflow to help users load administrative areas, connect to your source crime and call databases, and publish crimes and calls for service data.
The ArcGIS Pro project also provides optional tools to perform standard data transformations (adding standard NIBRS fields for offense, weapon, and location categories, as well as transforming date fields in text form) to make your data more useful. All tools can be scheduled to run automatically using ArcGIS Pro and Windows Task Scheduler. These tools help remove the burden of daily manual data processing so dashboards remain fresh and staff can get right to work on their primary duties.
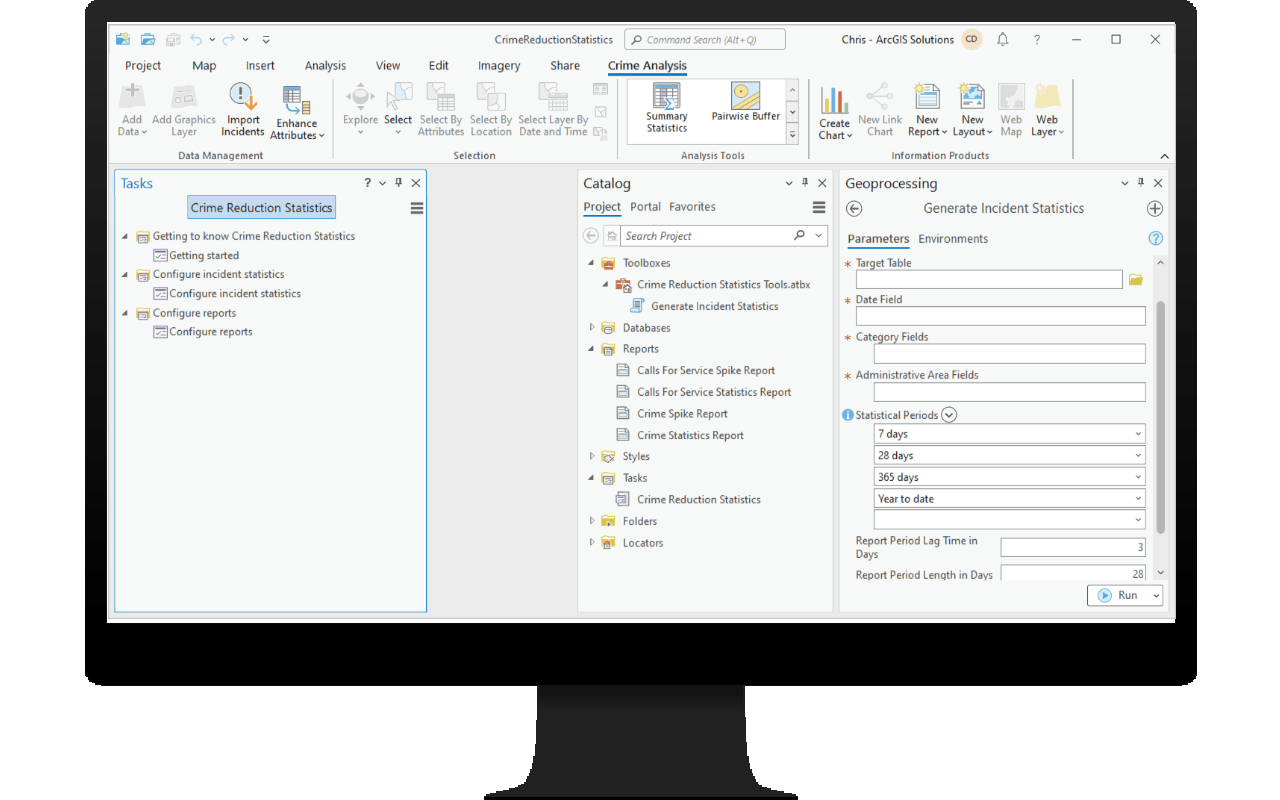
The Crime Reduction Statistics solution also includes the Crime Reduction Statistics ArcGIS Pro project. It can be used by crime analysts to automate production of key statistics and hard copy reports.
The project includes guided task workflows to help you generate and load percent change and spike statistics data for any combination of administrative areas and incident categories in your crime and calls for service data using a custom tool. The tool can be scheduled to run automatically using ArcGIS Pro and Windows Task Scheduler. These tools help dashboards remain fresh and reduce the staff time burden of manual statistics generation.
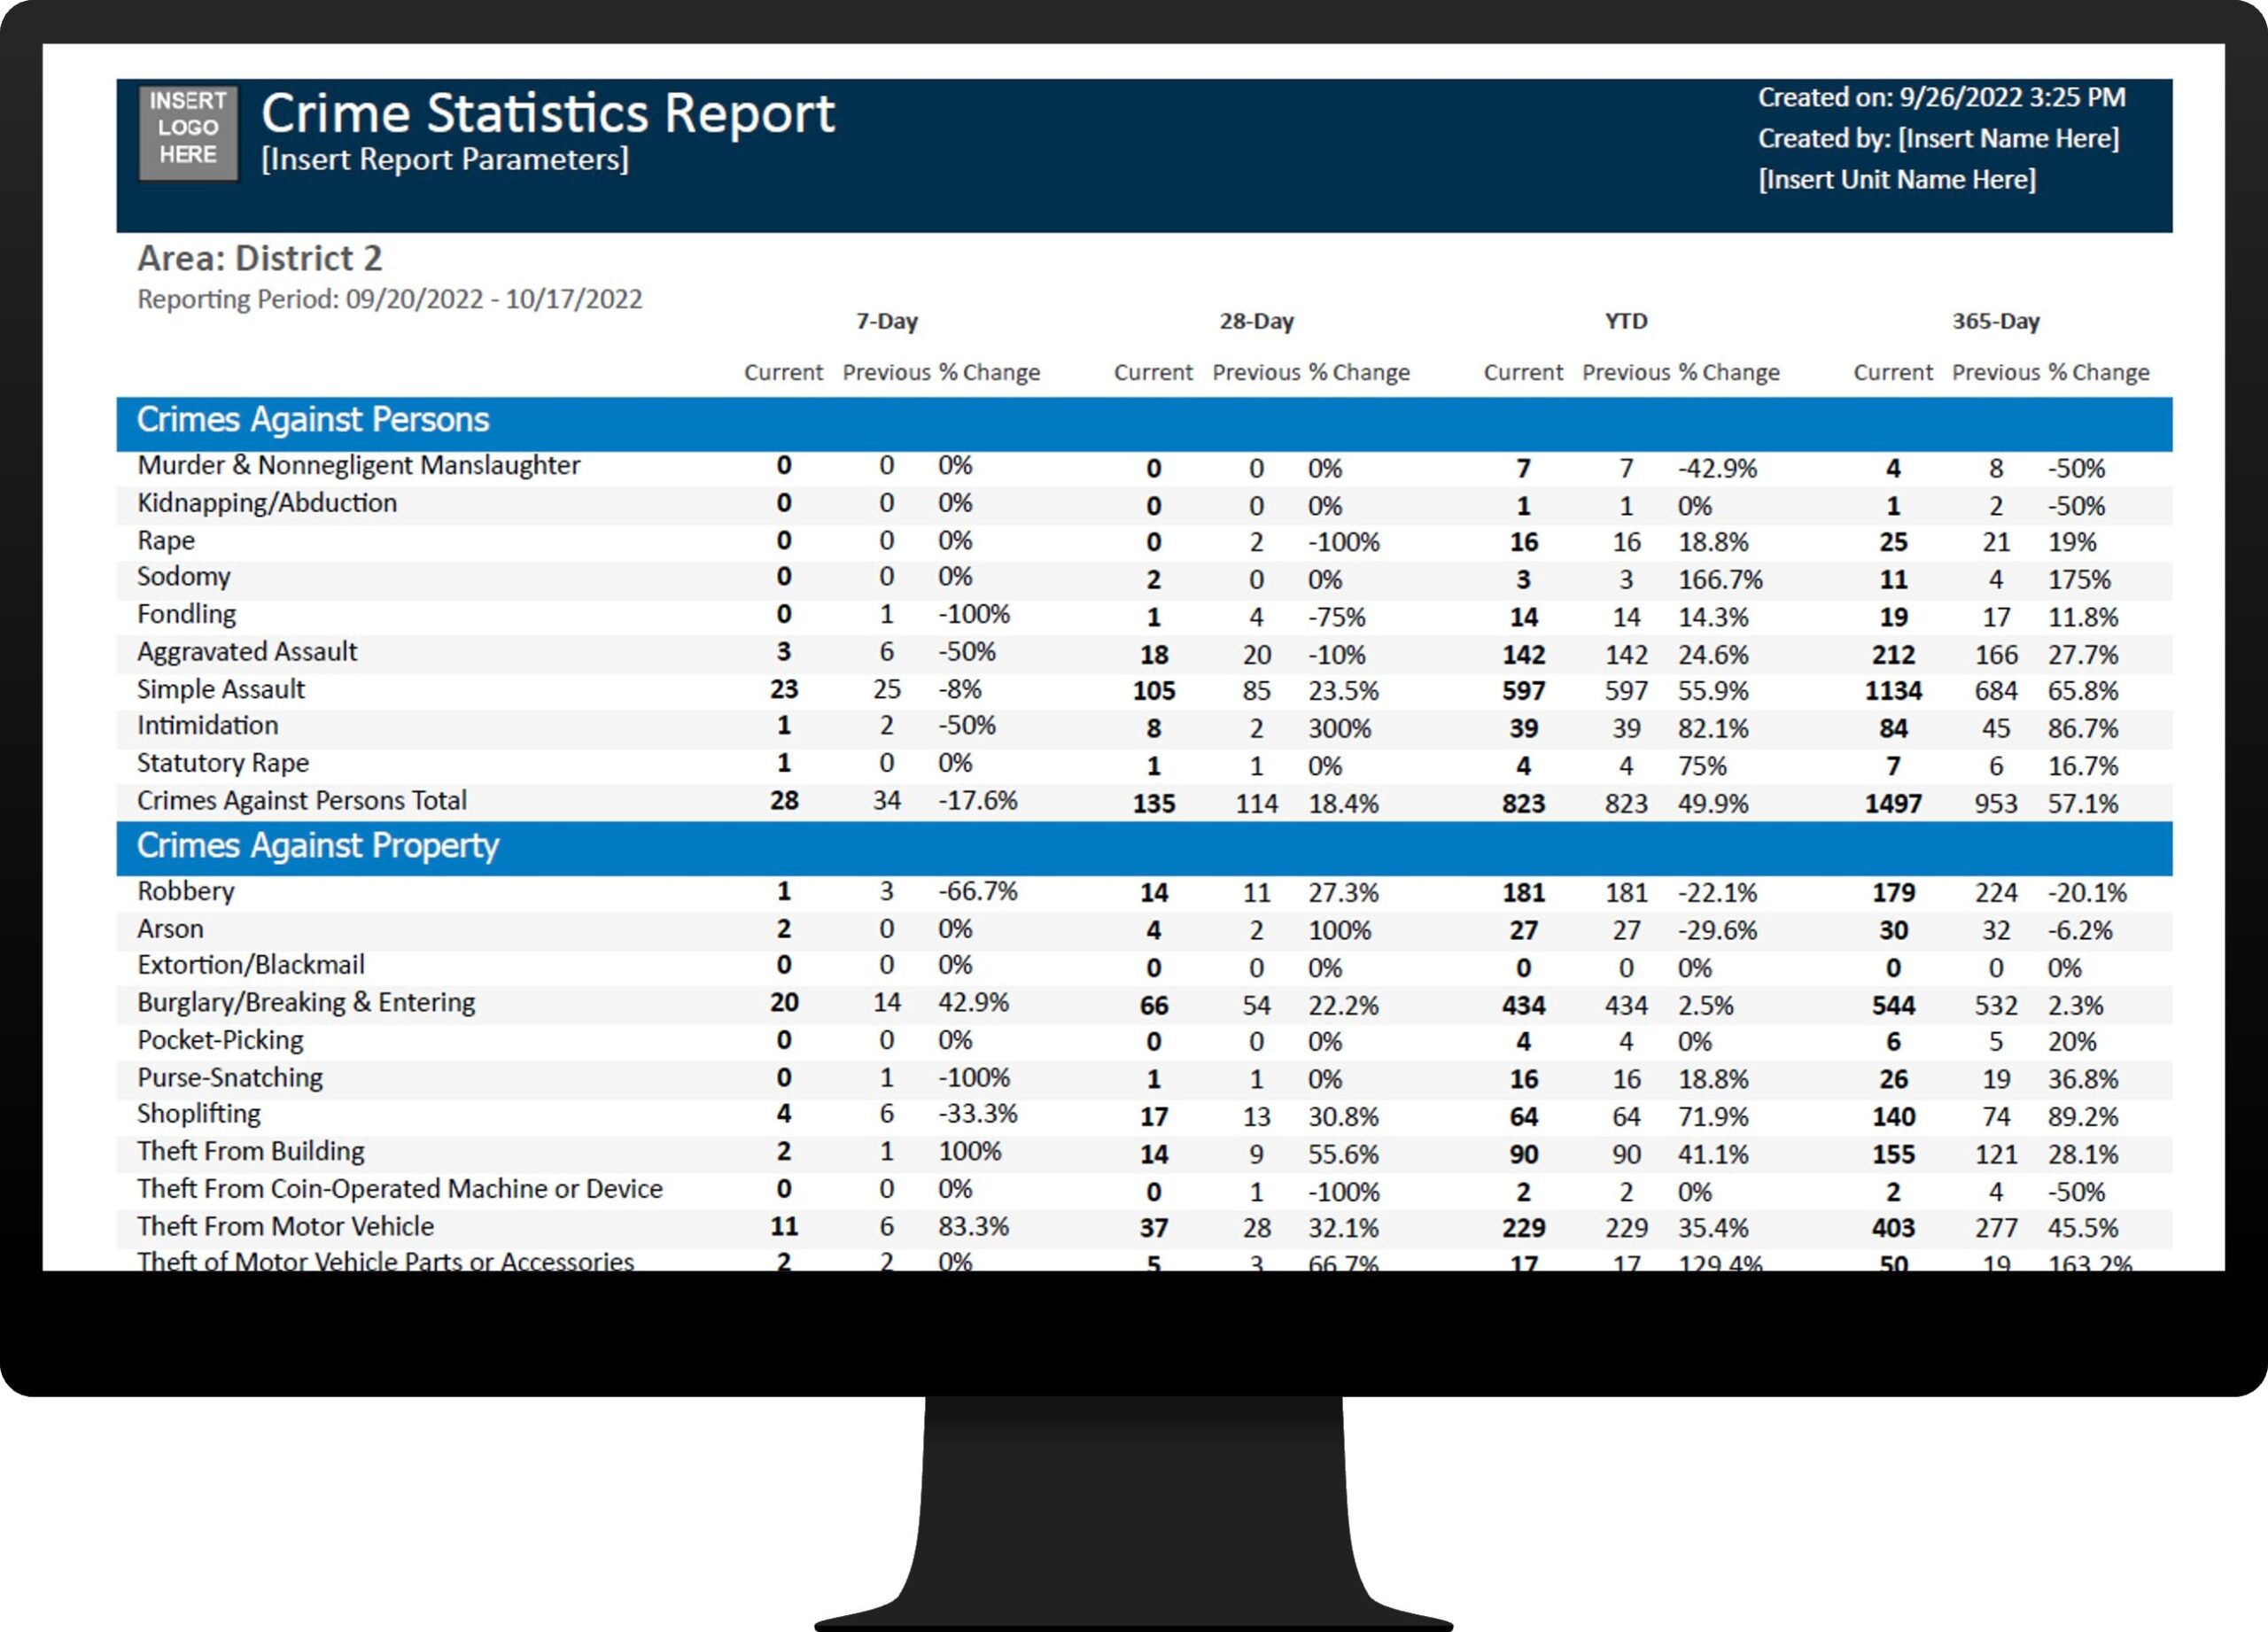
As hard-copy reports remain a requirement for many law enforcement agencies, the project also includes a series of hard-copy reports for percent change and spike statistics. These reports can be configured to meet the needs of your organization, and can also be scheduled to run automatically.
Crime Reduction Statistics is part of a collection of solutions for Law Enforcement, including Daily Activity Dashboard, Crime Analysis, and Police Transparency, that support crime reduction operations. Each of these solutions leverage common crimes and calls for service layers. For example, when you implement automated crime data loading for the Crime Reduction Statistics solution, subsequent solutions you deploy will leverage your existing Crimes layers in their maps and apps with no additional configuration required.
Additional resources
Learn more about Crime Reduction Statistics and how you can quickly deploy this solution on the ArcGIS Solutions gallery. For questions and feedback, chat with us on Esri Community or contact Esri Support Services.


Article Discussion: