It’s time to show the power of the services oriented architecture nature of the Utility Network Management extension. Currently ArcGIS Pro is the richest client for utility network functionality. However, that doesn’t mean that the functionality is not available for other clients. If ArcGIS Pro can do it, any other client can and that is the beauty of the SOA architecture. This blog post will walk through a simple web application example that I have authored which does a subnetwork trace using the ArcGIS for Javascript API 4.x hitting the utility network service. For simplicity we will be working with the DEFAULT branch in this sample. The example should work on any utility network service.
Note: The code here has been authored from scratch to hit the Utility Network REST API directly. With the Utility Network JavaScript SDK Enhancements these will be available out of the box for devs.
Connect to ArcGIS Enterprise portal
We start by providing the username and password of a user who owns at least one web map which has a utility network. Next, we attempt to connect by acquiring a token from ArcGIS Enterprise for the provided user. The query will list all web maps that the user owns. The reason this sample works with only webmaps, is we don’t want to load the raw feature service in the map view. We want to load a properly authored map with good scale dependency and well-crafted symbology.
Load Web Map and utility network Definition
When the user selects a web map, we do two things at the same time. 1) We check if the web map is pointing to a feature service and make sure that the feature service has a utility network. Only then we create a utilitynetwork object by passing the feature service URL and the token. The Utilitynetwork class is a helper class that does all the heavy lifting of querying various end points to pull the necessary meta data to open a utility network. 2) We load the web map into a Map View in the browser using the ArcGIS for Javascript 4.x api. The non-blocking asynchronous nature of javascript and promises allows the utility network to be created while the map view is loaded. The user can work with the map normally while the utility network object is being loaded.
Query and Highlight Subnetworks
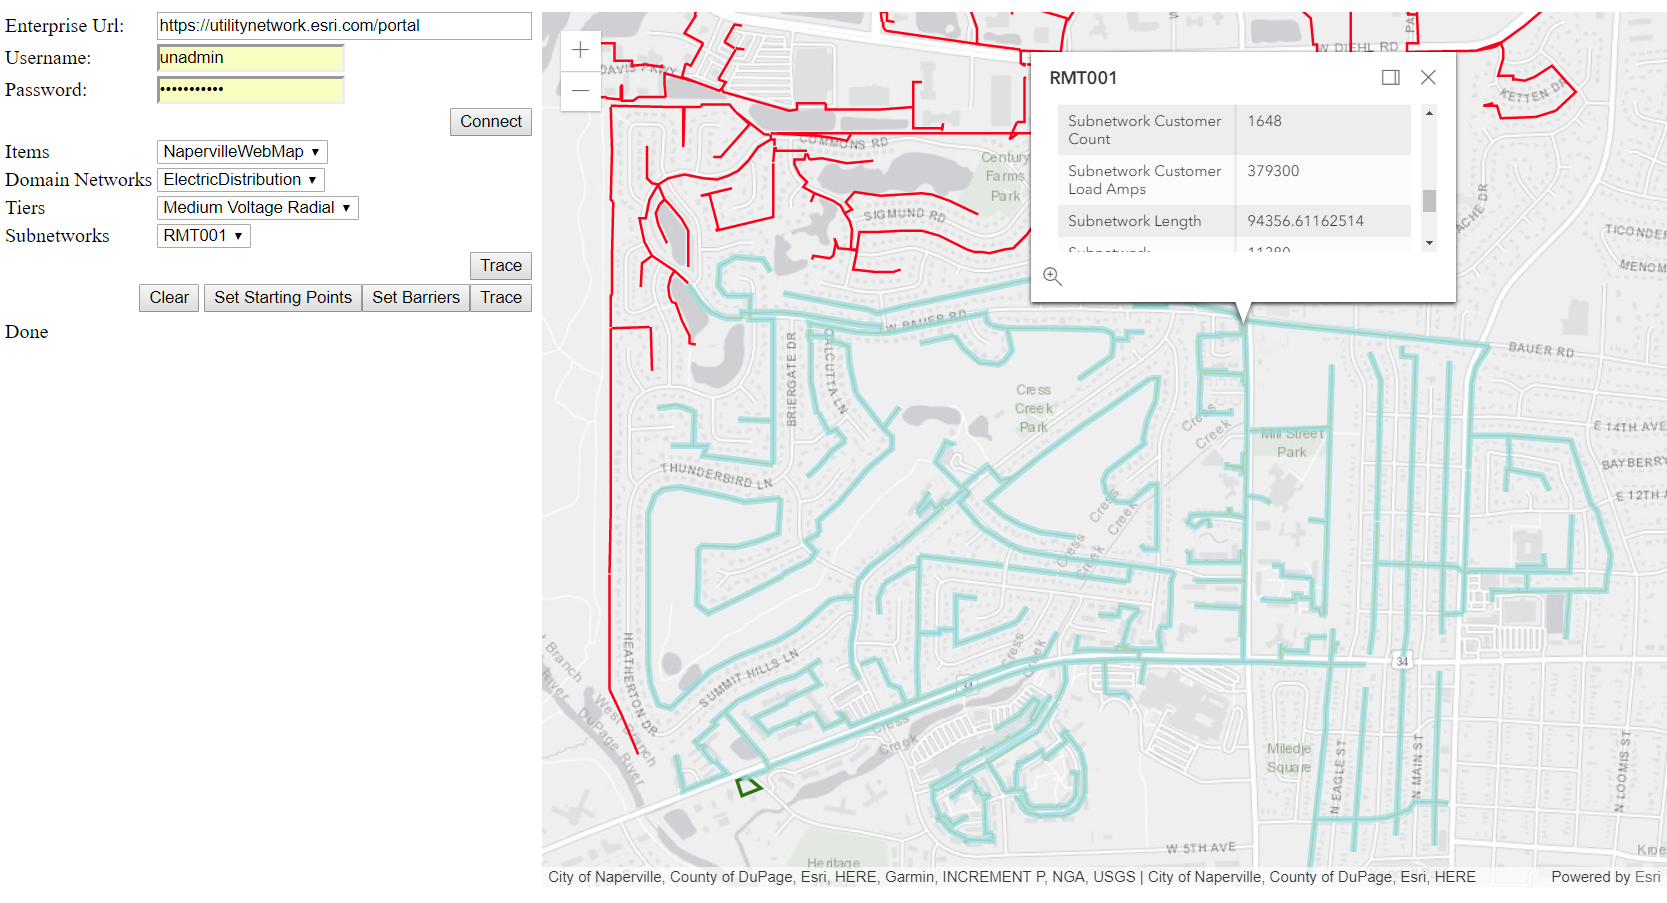
Once the utilitynetwork object is created, we can do the real work. We have access to the full definition of the utility network we can list cool properties like domain networks, tiers, network attributes etc. We first populate all the domains networks in the utility network in a drop-down list. When the user selects a domain network all the tiers that are available in that domain network will be populated. The user selects a tier, we call a rest endpoint to query the subnetworks table to filter out all subnetworks that belong to that tier. The subnetworks table is a special table published as a layer in the feature service. To get access to that layer we need to ask the utility network for its subnetwork layer id so we can query for subnetworks. The utilitynetwork helper class has a method to return the subnetwork table layer, you can look at the source code at the end of this blog to know how it’s done.
The fun part starts here when the user selects a subnetwork, and now we want to select the subnetline feature corresponding to the subnetwork. The subnetwork must be updated for this to work. Like the Subnetworks layer, the subnetline layer is a special system layer and we need to ask the utility network for its id. The utilitynetwork helper class has that method that returns the subnetline layer which is in the utility network definition. We then query that layer only returning geometry since that is the only thing we are interested in. Finally, we create a graphic of the returned geometry and add it to the map view making sure to clear all existing graphics to end up with multiple graphics on the map. Here is an illustration of the result.
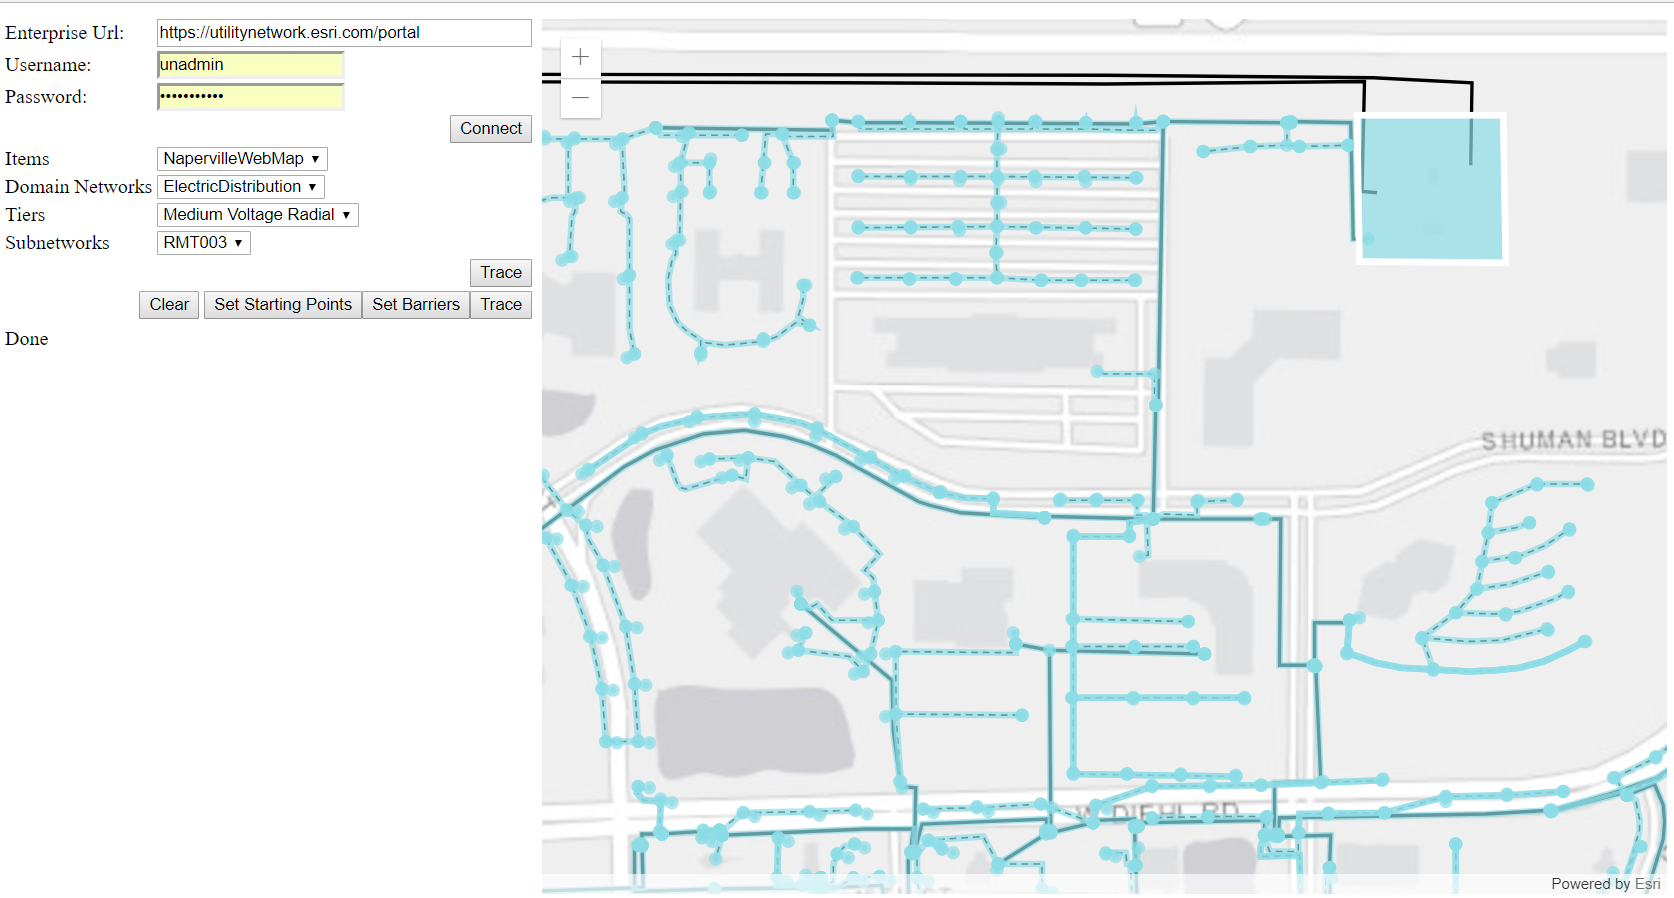
Trace
Up until here we did not use any of the utility network core functionalities. All of that was the power of the feature service. But don’t worry we are about to run our first web trace. The trace method is a REST end-point on the Utility Network Server extension. It takes many parameters, starting points, barriers, trace type, trace definition and many related to the version and moment which are optional. In this sample we will do one type of trace called Subnetwork Trace. We might cover other type of traces in future posts.
To run a subnetwork trace, the REST trace method is expecting the subnetwork name along with the domain name and tier name. Good thing we have all that! What we are missing is the subnetwork definition. The subnetwork definition is what predicate the “boundary” of a subnetwork, an example in the electric network would be stop the trace when it finds an open device. The subnetwork definition is part of the tier the subnetwork belongs to. To retrieve that we need to pull that of the tier, and since we have loaded the entire utility network definition, we have that in memory. We now need to send a POST request with all the information including the token, after all this is how Enterprise authenticates us. Leaving the version, sessionid and moment blank, the trace will be executed on the latest representation of the Default branch.
Trace Results
This is perhaps one of the most popular questions that comes from users of the utility network. How can I get the features from the trace results? The trace results by default returns an array of features, however it only returns these attributes “SourceID”, “GlobalID” and the “ObjectID”. No Layerid. The SourceID is an internal representation of the feature classes that acts as sources for the utility network. In the coming releases we will enhance the Trace end-point by returning the layerId however. Meanwhile we will have to map the SourceID to the LayerId. Luckily, we have that mapping in the Utility Network Definition and the Utilitynetwork helper class does have a nice method to getLayerIdfromSourceId that does just that. Now we will have to recollect all results grouped by layerId and objectIds and make few queries to retrieve the geometries of those features so we can draw graphics. After all what we are looking for is just to highlight the results on the map. Obviously, one can do more interesting things with the results of the trace.
Code: https://github.com/hussein-nasser/unjs
Important note on the token: The token is short-lived (usually 30 minutes) so you will need to regenerate the token before it expires.

Article Discussion: