TreeHacks 2021 was the seventh iteration of Stanford University’s premier hackathon. The theme this year was hacking for the future: addressing deeply impactful problems and building creative, unique solutions. There were five global and technological challenges: healthcare, education, civic engagement, sustainability, and social interaction. However, there wasn’t a strict guideline for what the hackers should work on. Hackers were encouraged to build anything that suited them. The hackathon team helped with “hack-packs”: resources like potential project ideas, data sets, APIs, and toolkits, to help the teams get started. Projects could include hardware and software.
TreeHacks applications were open to any enrolled college student (undergrad or grad) from all over the world. While current Stanford students were guaranteed admission, non-Stanford students applied and were able to attend only if invited. This year’s event was held virtually on the Ohyay platform and saw 2,000 registrations with 224 project submissions. Projects were submitted on Devpost.
Esri managed the event with a team of five, including Amy Niessen, Jim Barry, Armando Santana, Lingtao Xie, and John Foster. Jim led off the Esri engagement with a workshop that was held at 8 PM on Friday night in the hope to attract the hackers to ArcGIS before they started implementing their projects. We then utilized dedicated Slack channels and the Ohyay platform to engage with the hackers with questions, code sharing, problem solving, and ideation with ArcGIS.
Fourteen teams integrated ArcGIS into their project and competed for the Esri prize of $1,000 for the “Best Use of Esri Technology”. Over the course of the weekend, we saw many hackers attempt to use our developer APIs, platform services, and interactive tools to aid in their solutions. The Esri team was in demand throughout most the the event, constantly helping hackers in our sponsor room, sometimes with three or more teams queued up, and sometimes splitting up and going into team project rooms to provide assistance. We saw engagement with ArcGIS API for JavaScript, ArcGIS API for Python, ArcGIS Runtime SDK for iOS, Esri Leaflet, ArcGIS REST API, Web AppBuilder, ArcGIS Online, ArcGIS StoryMaps, and the developer’s website dashboard. All of the projects required integrations with other APIs and services, as none of the solutions were the typical GIS-first approach, requiring our APIs and data services to work alongside other developer products.

TreeHacks is one of the best hackathons attended to by some of the most capable college students. It was an honor to participate, represent Esri, and see firsthand how our developer technology can impact builders and innovators to integrate location services into their projects.
Some notable projects from this year’s hackathon:
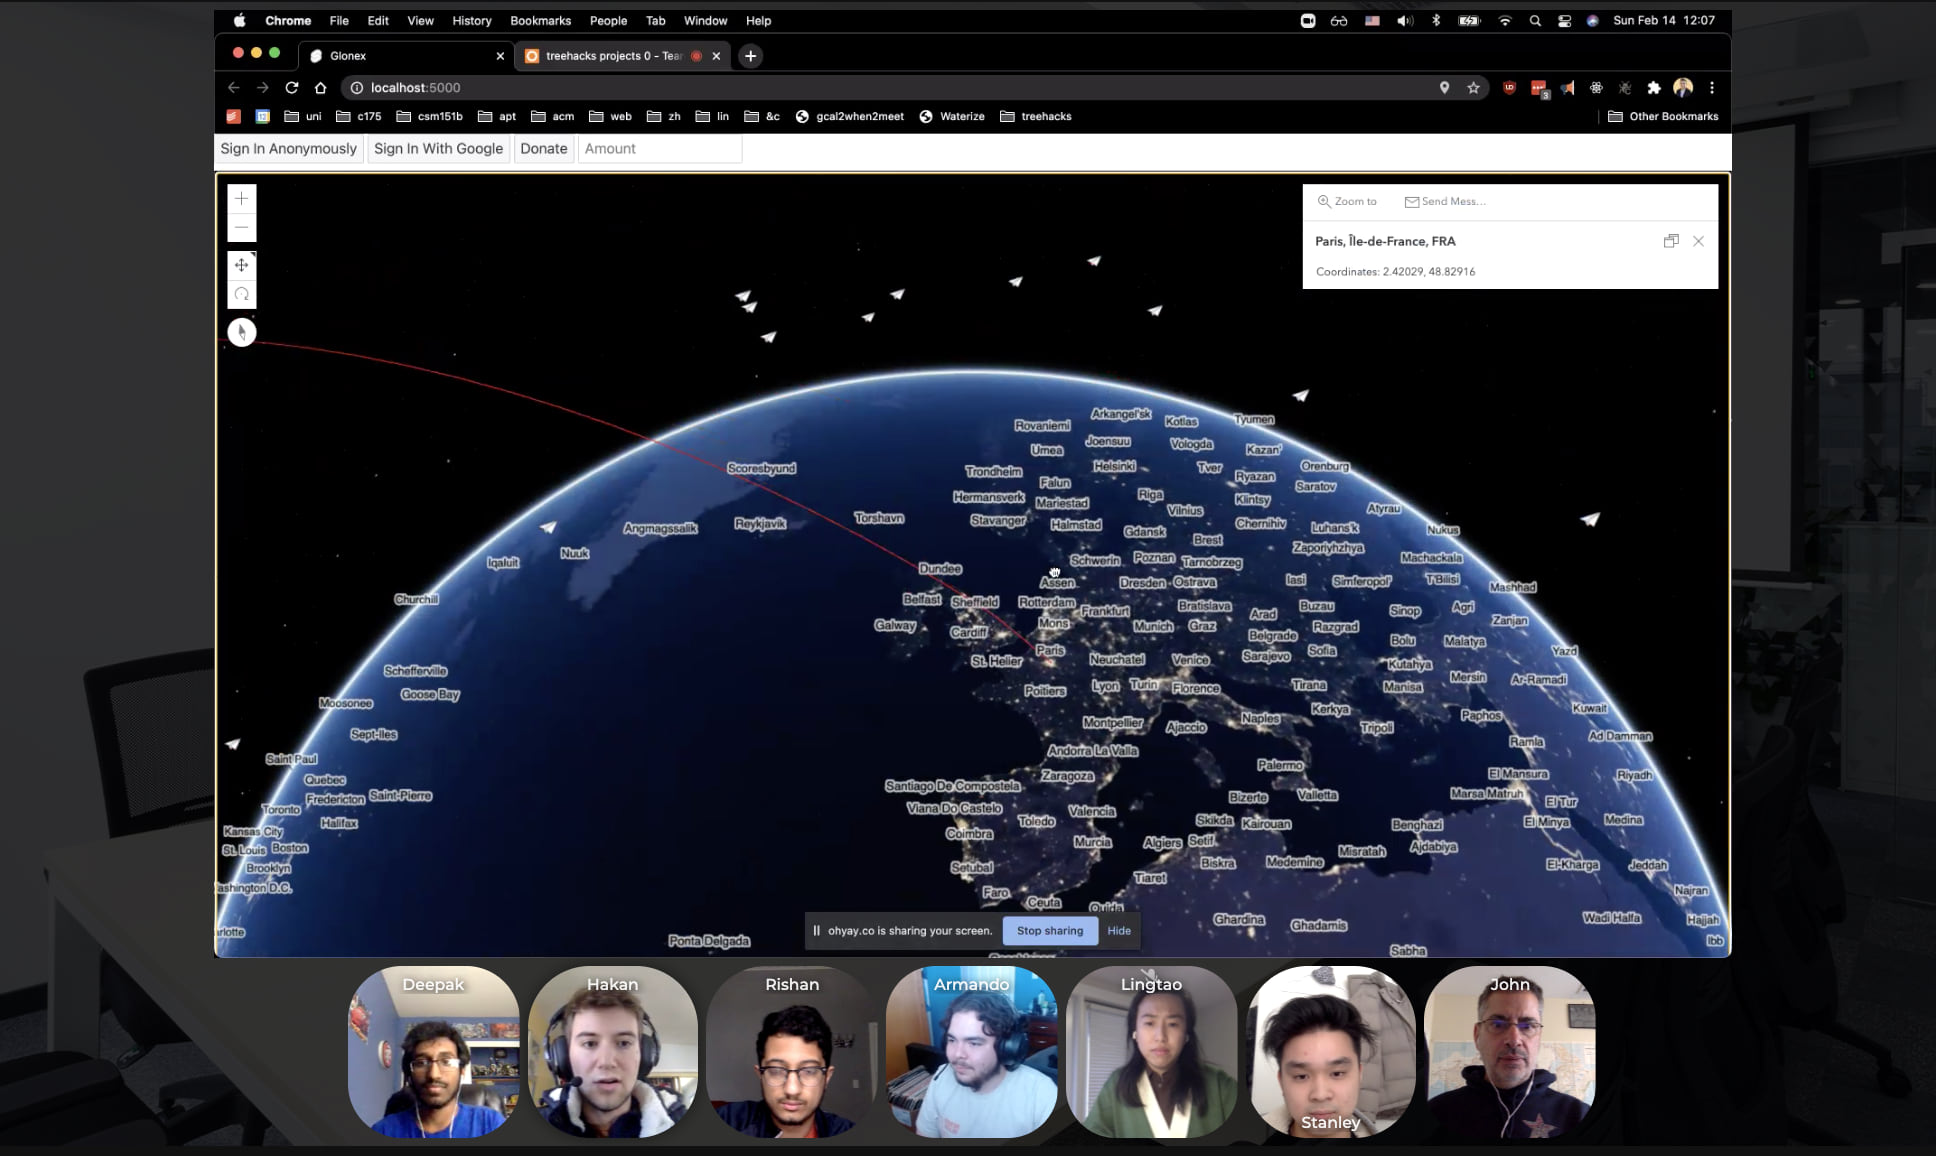
Glonex A highly interactive messaging app that lets users explore the world and identify locations where current events are happening and communicate with locals. They used a 3D globe visualization with the JavaScript API SceneView and graphics layer integrated with several other technologies. This project was awarded the Esri prize and was an overall finalist.
311 WhatsMyStatus Track, visualize, and perform analysis on city-wide 311 call data for Montreal. They used the Python API to load CSV call data and Web AppBuilder to visualize and analyze their data on an interactive map (dashboard).
Wonderly An immersive augmented reality platform to interact with the world’s greatest minds to learn from them anytime, anywhere, for everyone. They used the ArcGIS Runtime SDK for iOS with the AR Toolkit tabletop display to visualize maps in 3D to select personalities to interact with based on time and location.
Canary Bird observation and recording device (based on IoT raspberry-pi) built into a birdhouse recording event attributes into a feature service and visualizing and performing analysis on a web-based map using Web AppBuilder.
Blockfund A community engagement app to help communities vote on local project fund allocation and prioritization using blockchain and location. The project utilized ArcGIS REST API, web maps, and an ArcGIS StoryMap to visualize the geographic data they collected.
Our Home Connect local charities to community members that wish to open up their homes and hearts and offer assistance to other members of the community who may be experiencing homelessness or hunger. Integrated our JavaScript API into a Flutter cross-platform app utilizing feature service to record locations and display their attributes on a community map.
See all 14 projects in the project gallery on the Devpost project gallery.

Article Discussion: