ArcGIS GeoAnalytics Engine brings powerful spatiotemporal analysis and data science capabilities to your big data, in your cloud environments and data warehouses. Analysts and data scientists can leverage a comprehensive library of spatial functions, tools, and utilities that enable solving spatial intelligence questions at scale. This week we are excited to announce the latest release of GeoAnalytics Engine which includes a variety of new features and capabilities.
New spatial tools and functions
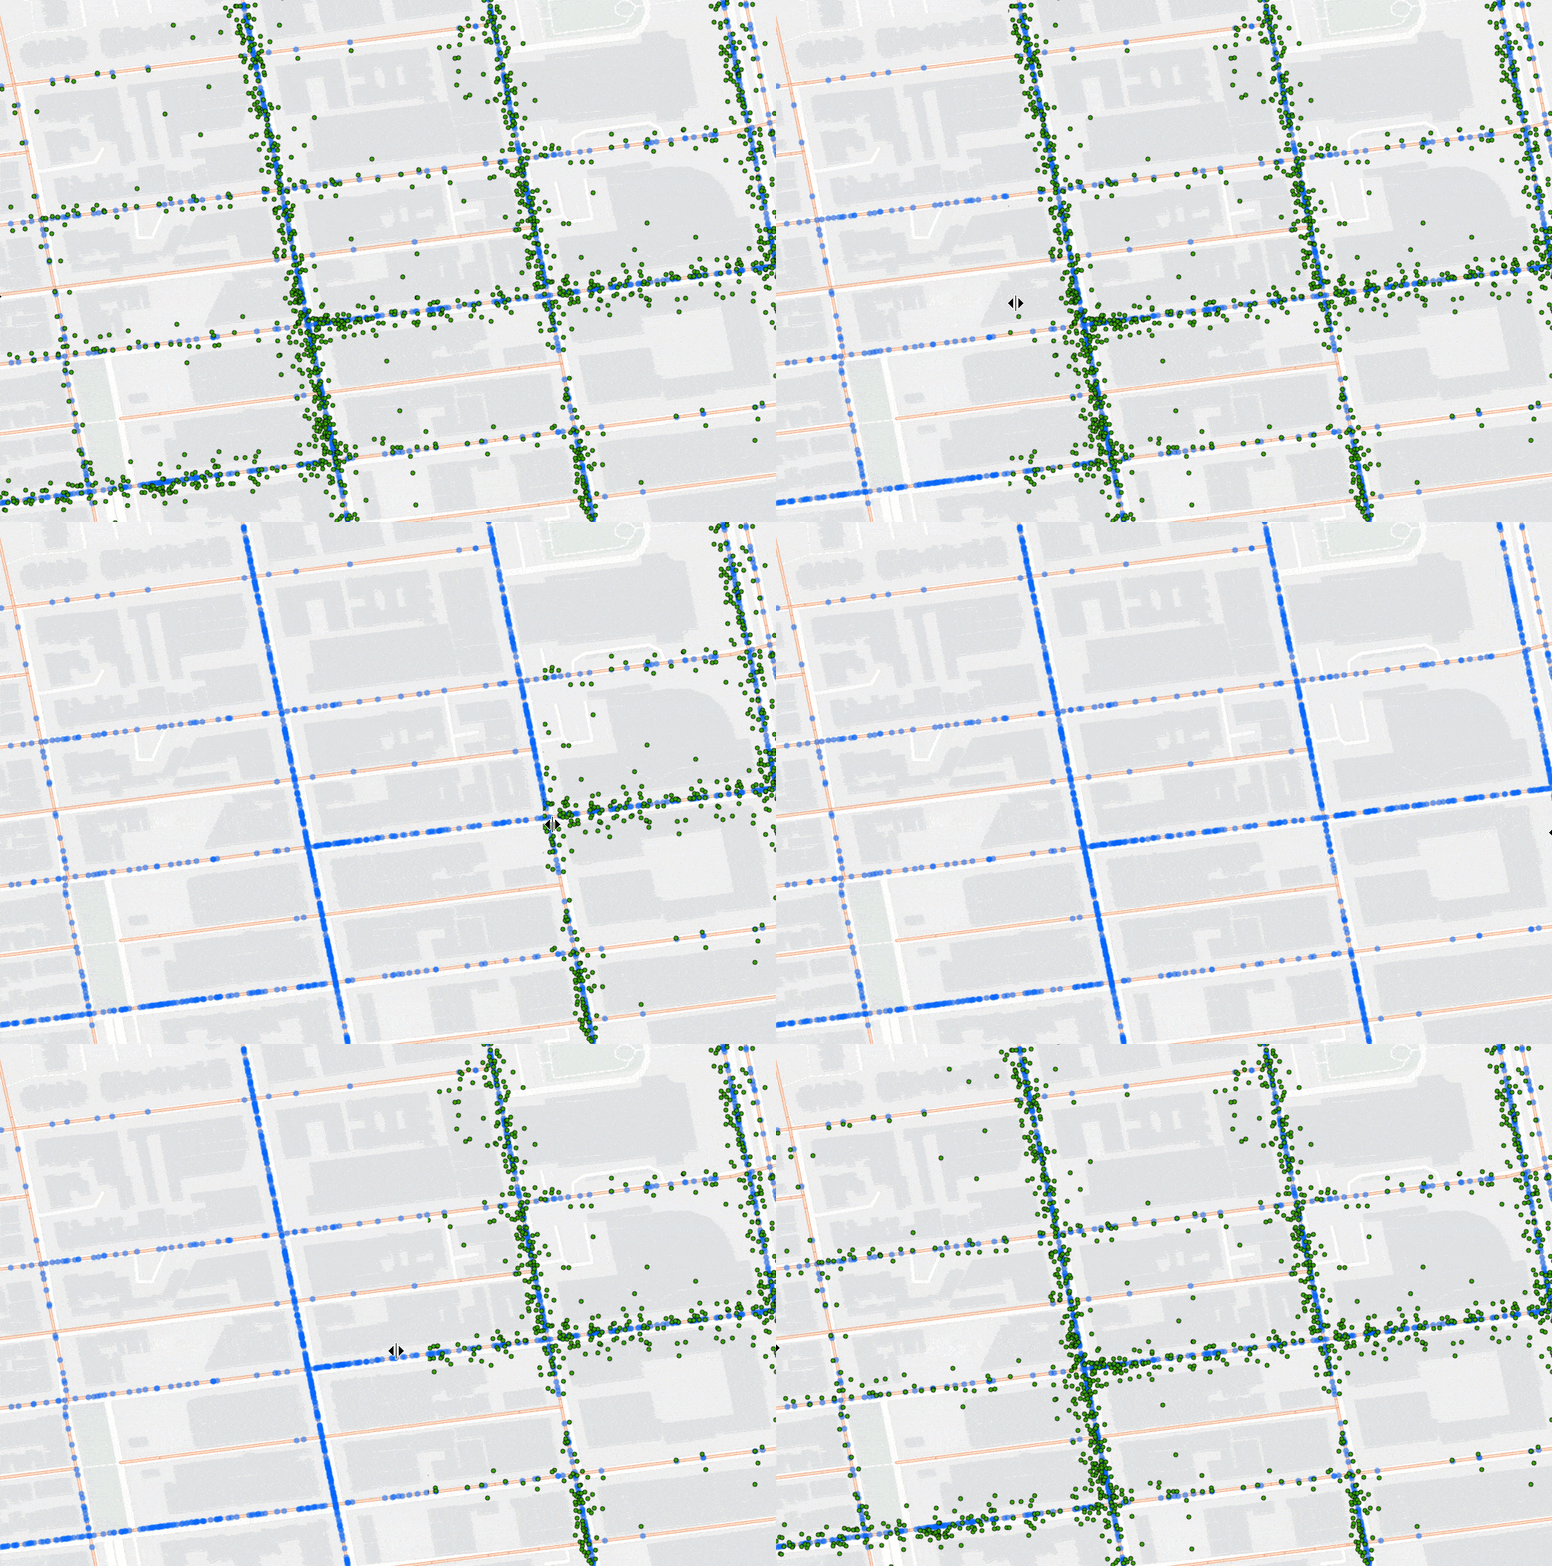
This release delivers many new analysis and indexing enhancements. The new Snap Tracks tool supports taking a set of location track data and generating a copy that adjusts the data to align with network lines (usually streets). The snapping is based on considerations such as the observation’s distance to the line and the previous and future observations. It can be used to improve visualization of track data as well as other downstream analytics such as calculating more accurate route and movement behavior patterns.

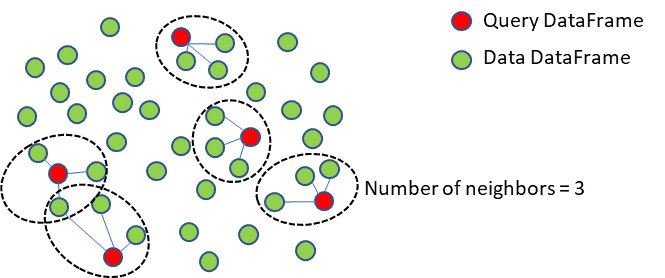
Another new tool, Nearest Neighbors, identifies a given number of nearest spatial records to each of a set of input spatial records. This is a useful enrichment capability that can be used to support questions such as determining candidate facilities to satisfy demand (in commercial and logistics workflows), or – categorizing the most common competitors for retail locations, as well as summarizing their average distance.

Users also have several new spatial functions available to them in this release. Most notably, there are new functions ST_H3Bin/H3Bins and ST_BinId that enable indexing data by the H3 bin specification, which is a hierarchical geospatial indexing system commonly used for easily summarizing point data and showing high level patterns. Other new functions, ST_ClosestPoint and ST_ShortestLine (and their geodesic equivalents), continue to expand the set of proximity utilities in GeoAnalytics Engine, and the new ST_Densify/GeodesicDensify functions enable adding vertices and shortening segment length on complex features, which can support workflows around aligning datasets that come from different sources.
New and improved support for common data formats
Format support has been broadened in this release to include GeoJSON for both data ingress and egress, further enabling users to work with common sources of data. Additionally, data can now be read in and written out in the GeoParquet format. GeoParquet is a format gaining popularity across a variety of industries, and support in GeoAnalytics Engine broadens the ability for users to work with data directly, in the common forms used in their data lakes and data stores.
New, out-of-the-box capabilities have also been added to support saving output data to feature services hosted in ArcGIS Enterprise or Online. Using the GeoAnalytics Engine library in a script or a notebook, users can now save output data to a new layer, overwrite an existing layer, or append to a layer, all using the Spark DataFrameWriter. These streamlined options for storing output data to feature layers make it easier to visualize analysis results and share information products for strategic decision making.

Visualization and data transformation
Other significant enhancements in this release include improvements for coordinate systems and transformations, including broad support for WKT identifiers across all spatial functions that accept a spatial reference as input. Additionally, there are new utilities to allow a user to look up the list of supported spatial references and transformations, from within the scripting environment, making it quicker to identify and select the one they need to work with.
Visualizing intermediate and output data via the lightweight plotting method now has support for displaying ArcGIS basemaps, making it easier to understand the geographic context for your data. The basemaps supported include the Light Gray Canvas, Dark Gray Canvas, Streets, and OpenStreetMap.

Lastly, the GeoAnalytics Engine 1.1 release also adds support for Spark 3.3.1 and the latest runtimes for Databricks and AWS EMR.
For more information on the latest features, check out the product release notes or stop by the GeoAnalytics Engine Community Site for resources on getting started, tips and tricks with various tools, and much more!


Article Discussion: