Time series graphs help in visualizing trends over time whereas line graphs visualize a sequence of continuous numeric values. When working with a large number of categories or large datasets, it can be challenging to glean useful information if the lines are indistinguishable from each other.
With the latest release of ArcGIS Insights (2022.3), enhancements have been made to time series graphs and line graphs, improving the way in which you can interpret the information shown on your cards.
Apply patterns
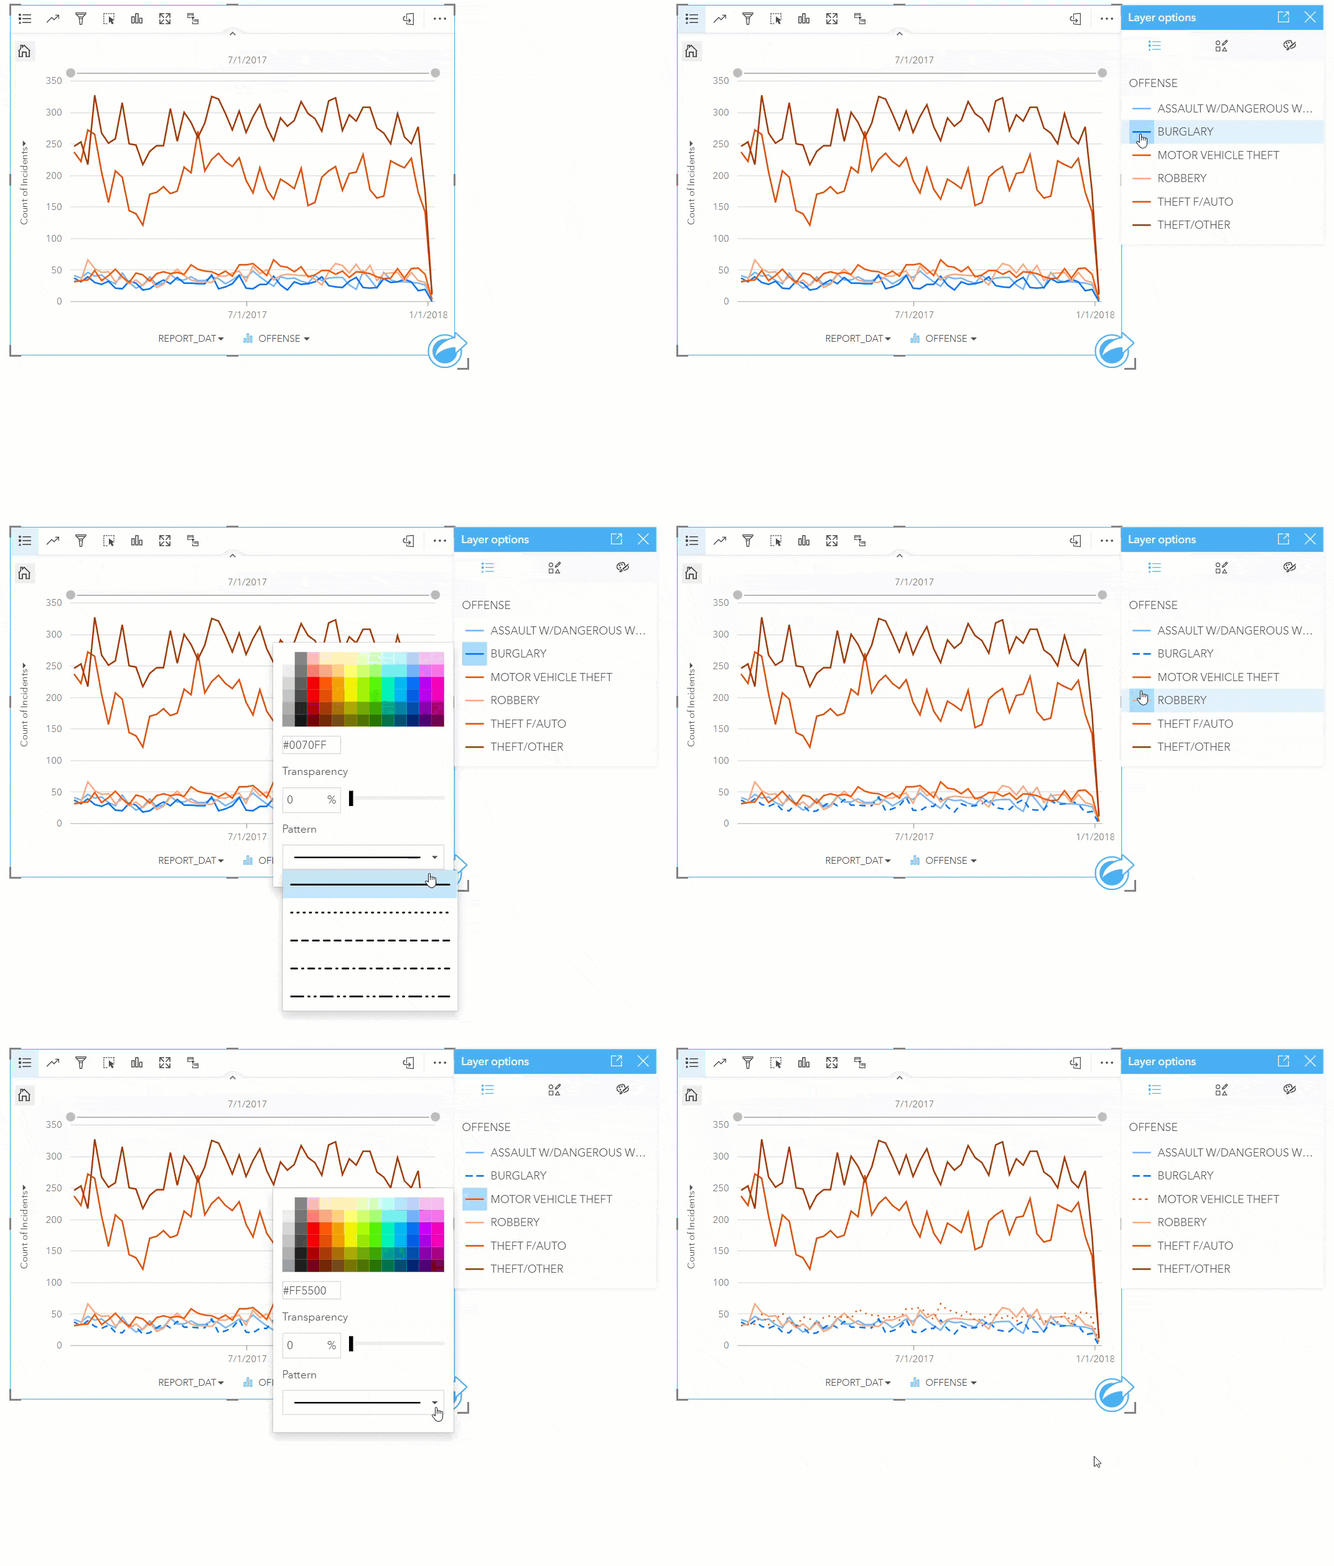
When working with time series graphs or line graphs grouped by category, often a lot of information is shown at once. In addition to customizing the color for each value on the graph, you can now assign a specific pattern to each value to further improve distinguishability. Clicking on the symbol for each individual value within the Legend opens the color picker, which enables you to update the color and assign a specific pattern to that value. If you want to change the pattern for all lines on the graph, you can still do that using the pattern drop-down menu in the Appearance tab of the Layer options pane.

Highlighting your selections
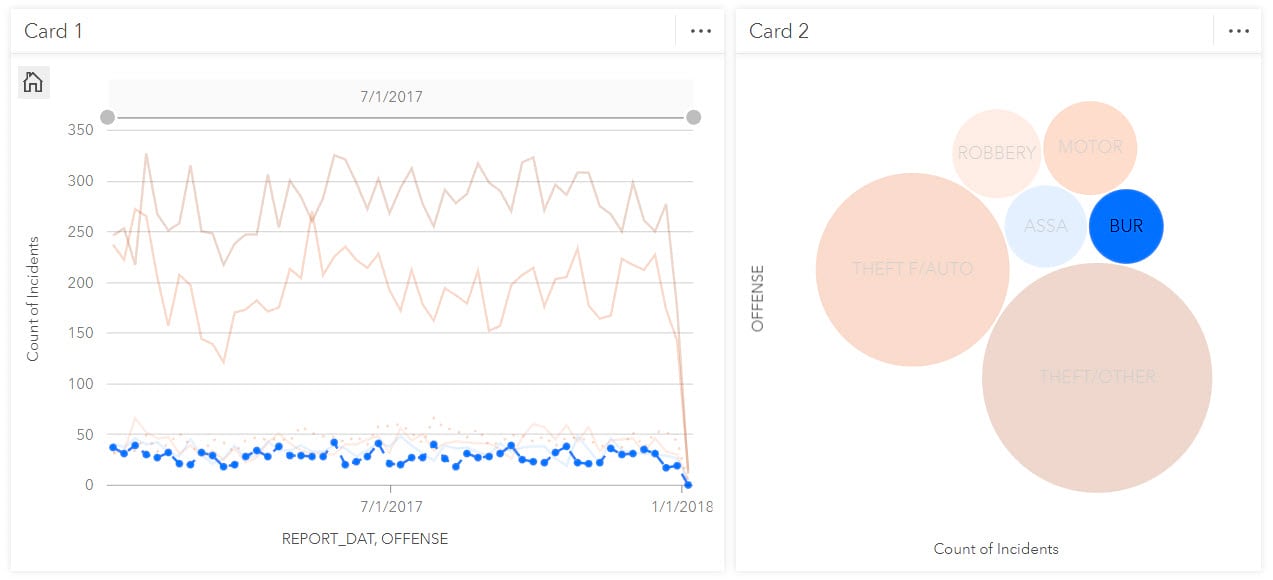
Interactions between graphs, tables and maps is a critical step in an analysis workflow to understand the data or highlight important information. Selections aid in this process by highlighting areas or points of interest in related cards that are from a common dataset. Time series graphs and line graphs will now highlight the relevant information while fading out anything not pertaining to your selection.

With these new enhancements you can style your time series graphs and line graphs to enhance the interpretability of the graphs.
To learn more about ArcGIS Insights go to our Insights Overview page or help documentation.

Article Discussion: