Have you ever stopped to notice all the people typing away into their phones and laptops during your commute or coffee break? Every single sentence, emoji and acronym is communicating a thought or opinion. People are constantly talking about their lives and leave a trail of valuable data behind as they do so. Insights for ArcGIS can help you tap into this data source and turn it into a wealth of information for your organization.
Scripting in Insights allows you to extend your Insights workflows in exciting new ways. You can write functions from scratch or use existing APIs rather than scripting things on your own.
In this post we will show how to pass your data to the Microsoft Azure Cognitive Services Text Analytics API. Services such as the Text Analytics API make it straight-forward to find insights from text with a minimal amount of scripting.
Text Analytics
Text analytics is the process of deriving high-quality information from unstructured textual data. For example, the comments, descriptions, or reviews on social media. Because of the free-form nature of text, standard analysis tools often fall short of uncovering the true value in this data.
Due to the varied ways humans write, it is a complex task to analyze text. There is an entire branch of Artificial Intelligence dedicated to the practice known as Natural Language Processing (NLP). NLP allows computers to understand, interpret and manipulate human language.
The information gained from NLP is an important resource for businesses, research, and intelligence. You gain an understanding of the general attitude of people towards a product or idea. Discussions about a topic may follow patterns. Specific people, places, organizations, or topics become themes.
To illustrate this, we will perform text analytics on a data set of AirBNB listings which includes comments from users.
Unstructured Text
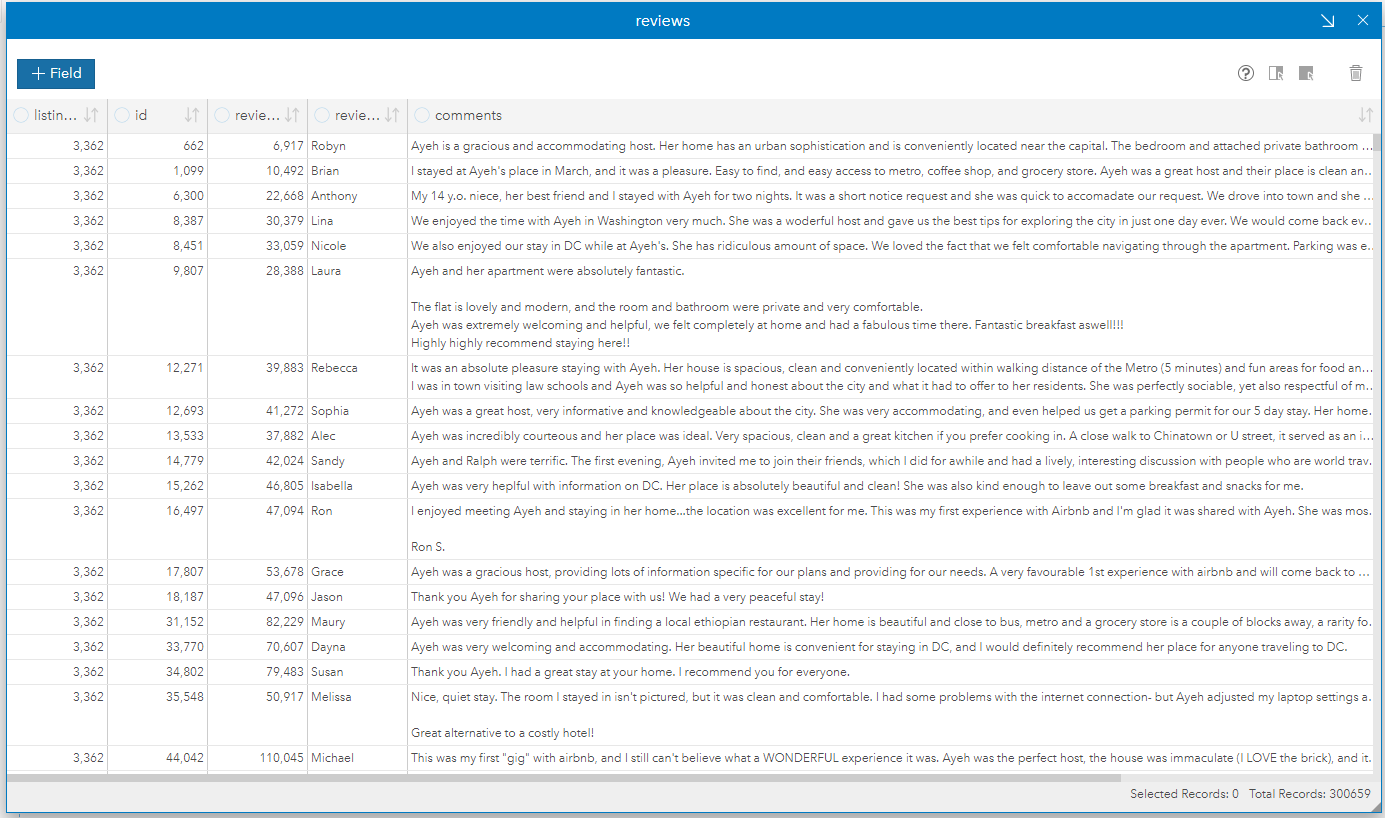
Unstructured Text is content that does not conform to a format or indexing schema. It is the largest human-generated data source on the web, because it is how we communicate our thoughts and feelings. There are over 300, 000 comments extracted from AirBNB for listings within Washington, D.C. alone.
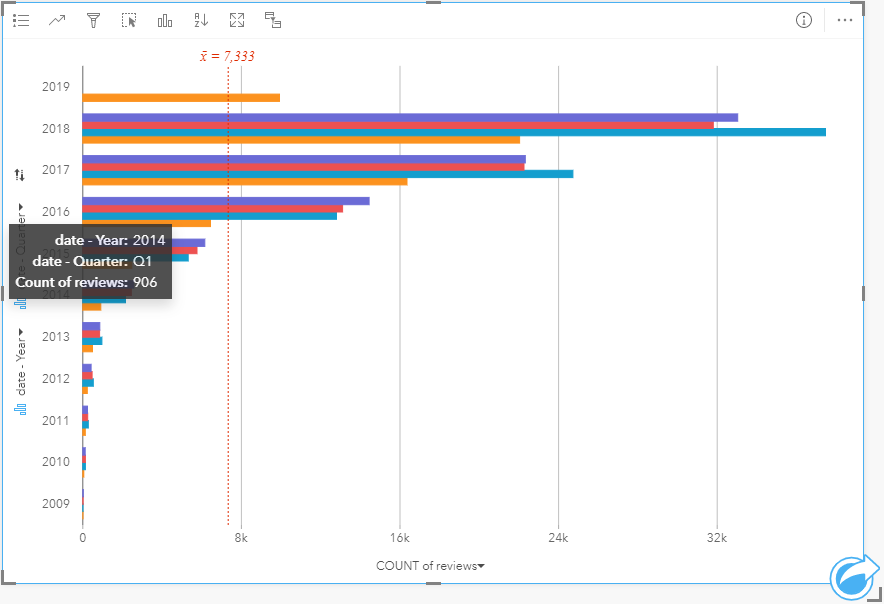
We will reduce the volume of data by using Insights’ filters. The text analytics API provides a data limit of 1,000 documents per request. Therefore we can visualize the number of reviews per quarter to find one which has close to that number of records. The first quarter of 2014 has 906 reviews, which is a good amount for us to work with.
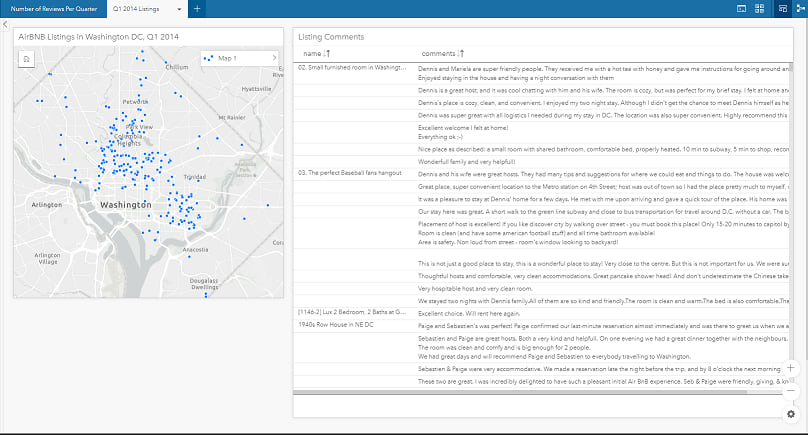
Insights’ filters make it easy to reduce the data set down to Q1 2014 with a few clicks. We then add the AirBNB listings data, which includes the coordinate location of each home that is available for rent. Finally, we join the comments to the listings by the listing ID. The result is a set of 906 unstructured text comments joined to 225 listings.
Scripting in Insights
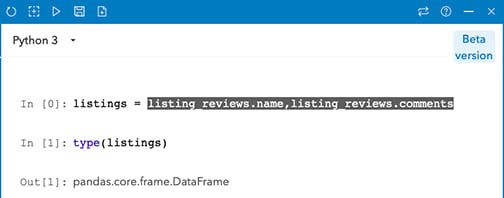
It is easy to use the joined table in your script. Simply drag and drop the data set from the data pane into the console’s input field. We create a data frame with this action and assign the variable name listings.
Data frames are central to data science in both Python and R. Therefore, the console supports a wide range of functionality right out of the box. The Cognitive Services API expects records in JSON format. We can convert from a data frame to JSON in 3 lines of Python code.
import json

reviews = json.loads(listings.to_json(orient='records'))
records = [{'id': i, 'text': reviews[i]['comments']} for i in range(len(reviews))]
documents = {'documents': records}
Microsoft provides a quickstart guide for using Python to call the Text Analytics API. The above code formats our data into the structure that the guide describes. We then send the data to the API.
We will set up a few variables in the console to make the API calls easier. The quickstart guide provides example code that we can use. Please note that you need to sign up for an Azure account and generate your own subscription key to run the code in this post.
import requests

key_file = open('insights-demo-key.txt')
subscription_key = key_file.readline()
header   = {"Ocp-Apim-Subscription-Key": subscription_key}

text_analytics_base_url = "https://westcentralus.api.cognitive.microsoft.com/text/analytics/v2.1/"
language_api_url = text_analytics_base_url + "languages"
sentiment_api_url = text_analytics_base_url + "sentiment"
key_phrase_api_url = text_analytics_base_url + "keyPhrases"
entity_linking_api_url = text_analytics_base_url + "entities"
Calling the Cognitive Services API
There are four cognitive services endpoints that we will call: Language Detection, Sentiment Analysis, Key Phrase Extraction, and Entity Identification.
First of all, the documentation shows that Language Detection and Entity Identification methods can use our JSON as-is, while Sentiment Analysis and Key Phrase Extraction need the language specified.
Because of this, we will call the Language Detection and Entity Identification endpoints first, then use the Language Detection results to enrich our data before we send it to the other endpoints. Since we have already set up our variables, it is only a few more lines of code to call the API.
language_response = requests.post(language_api_url, headers=headers, json=documents)
entity_response = requests.post(entity_api_url, headers=headers, json=documents)
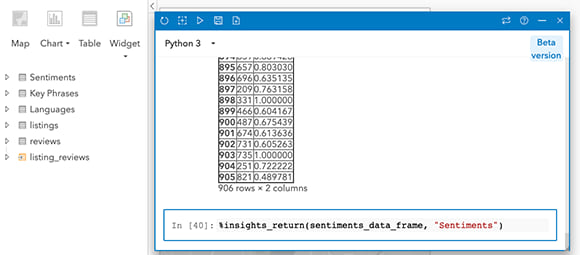
We then add the language code from the results to our JSON because the Sentiment Analysis and Key Phrase Extraction endpoints require it. Once we have sent these requests, the 4 JSON responses are converted to a data frame and then added to our Insights data pane using the %insights_return magic method.
languages = [language['detectedLanguages'][0]['iso6391Name'] for language in language_response.json()['documents']]
for i, doc in enumerate(documents['documents']):
  doc['language'] = languages[i]
The Results
It is easy to convert our results back to Insights data sets for further visualization and analysis. We simply convert the results back to a data frame, then use the magic method to create a new data set in the Insights data pane.
Log in to Insights today and explore the possibilities of Text Analytics on your data. Insights is available in a free 21-day trial if you’re not already using it, so Sign up today!
In the upcoming Part 2 post, we explore and perform further analysis on the newly created data sets. Use the social media links below to stay tuned!
Commenting is not enabled for this article.