Introducing data engineering in ArcGIS Insights desktop 2022.2. Replace those empty strings and nulls, convert incorrect column types, explore your data, and get your data ready before you dive into analysis.
What is data engineering?
While you have always been able to manipulate your data in Insights, for example, to change the data type or filter your data, data engineering adds more data management functionality. By enabling you to process your data upfront it will streamline your analysis. In Insights desktop 2022.2, you’ll notice a new section called Data Engineering, which is in preview. Data engineering preview offers you a full-functioning, non-beta experience. However, it is only available in Insights desktop and will be enhanced with more tools in future releases.
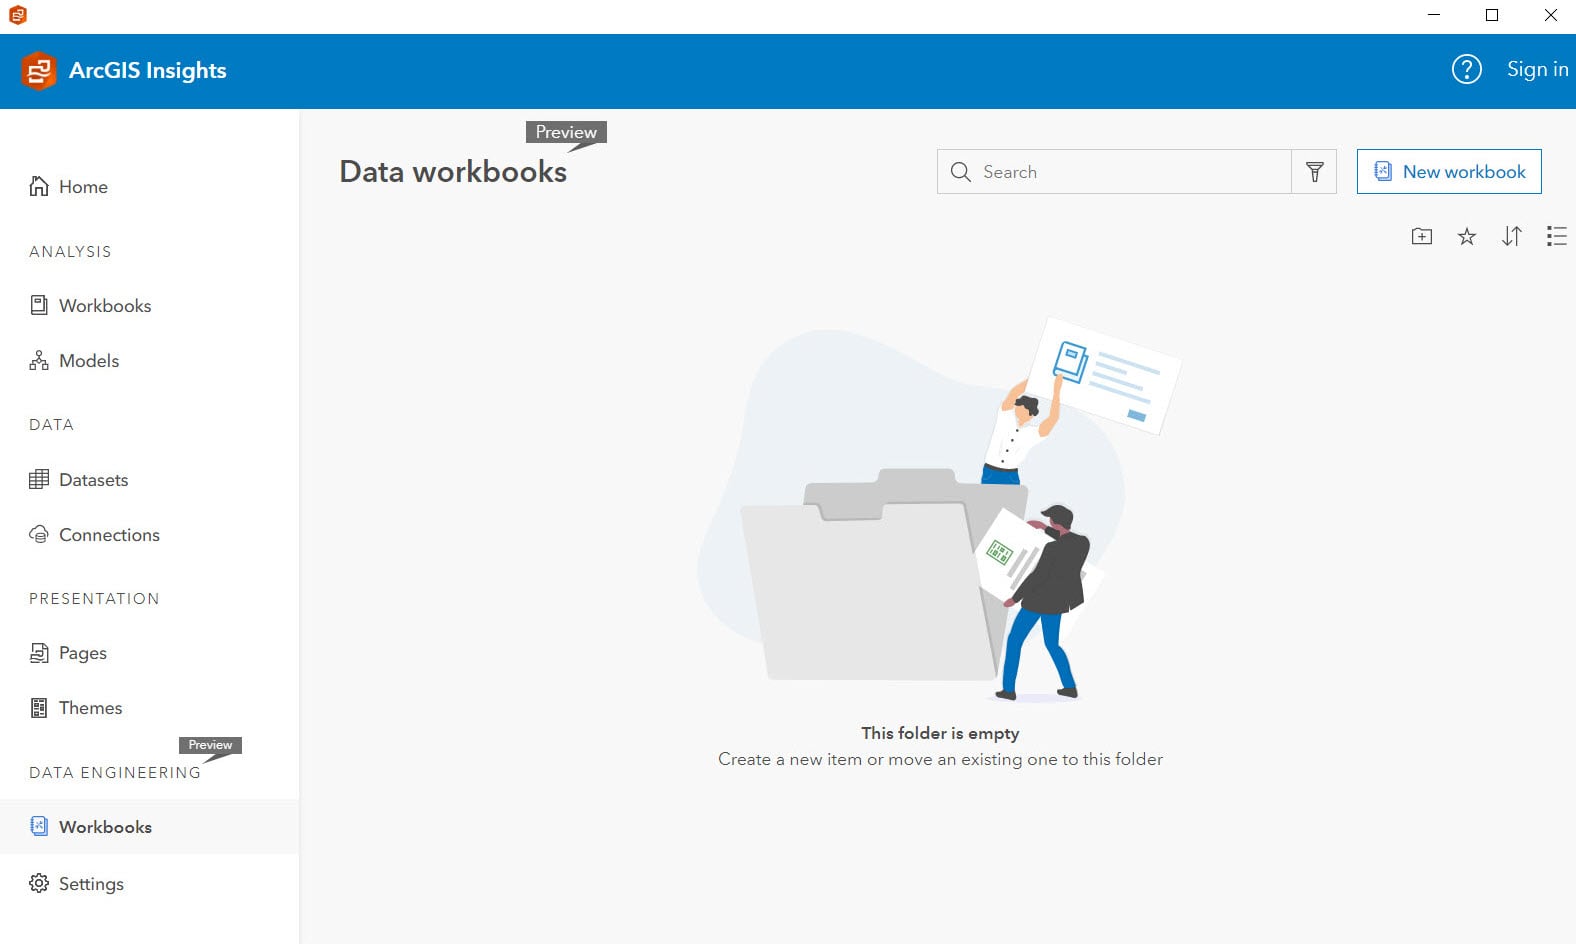
New workbooks, specifically for data engineering, are now available in the home page where you can clean and prepare your data before you start your analysis.
How to perform data engineering
On opening a new data workbook, you will be greeted with the Add to page dialog box which has been expanded to allow you to sample and filter your data before it is loaded into the data workbook. To filter out specific columns or apply advanced filters, open the import options. To make it easier to work with the data, a preview subset of the data is shown in the table.

Data engineering is always run on your entire dataset, however, to ensure faster processing time as you work with your data, sampling is used to reduce what is shown in the workbook when the data is over a certain threshold (250,000 in the 2022.2 release). Different sampling methods are available, plus the sampling value can be increased.
The data workbook creates the model and displays the data table with the sampled tag (if applicable) for the dataset that was added.
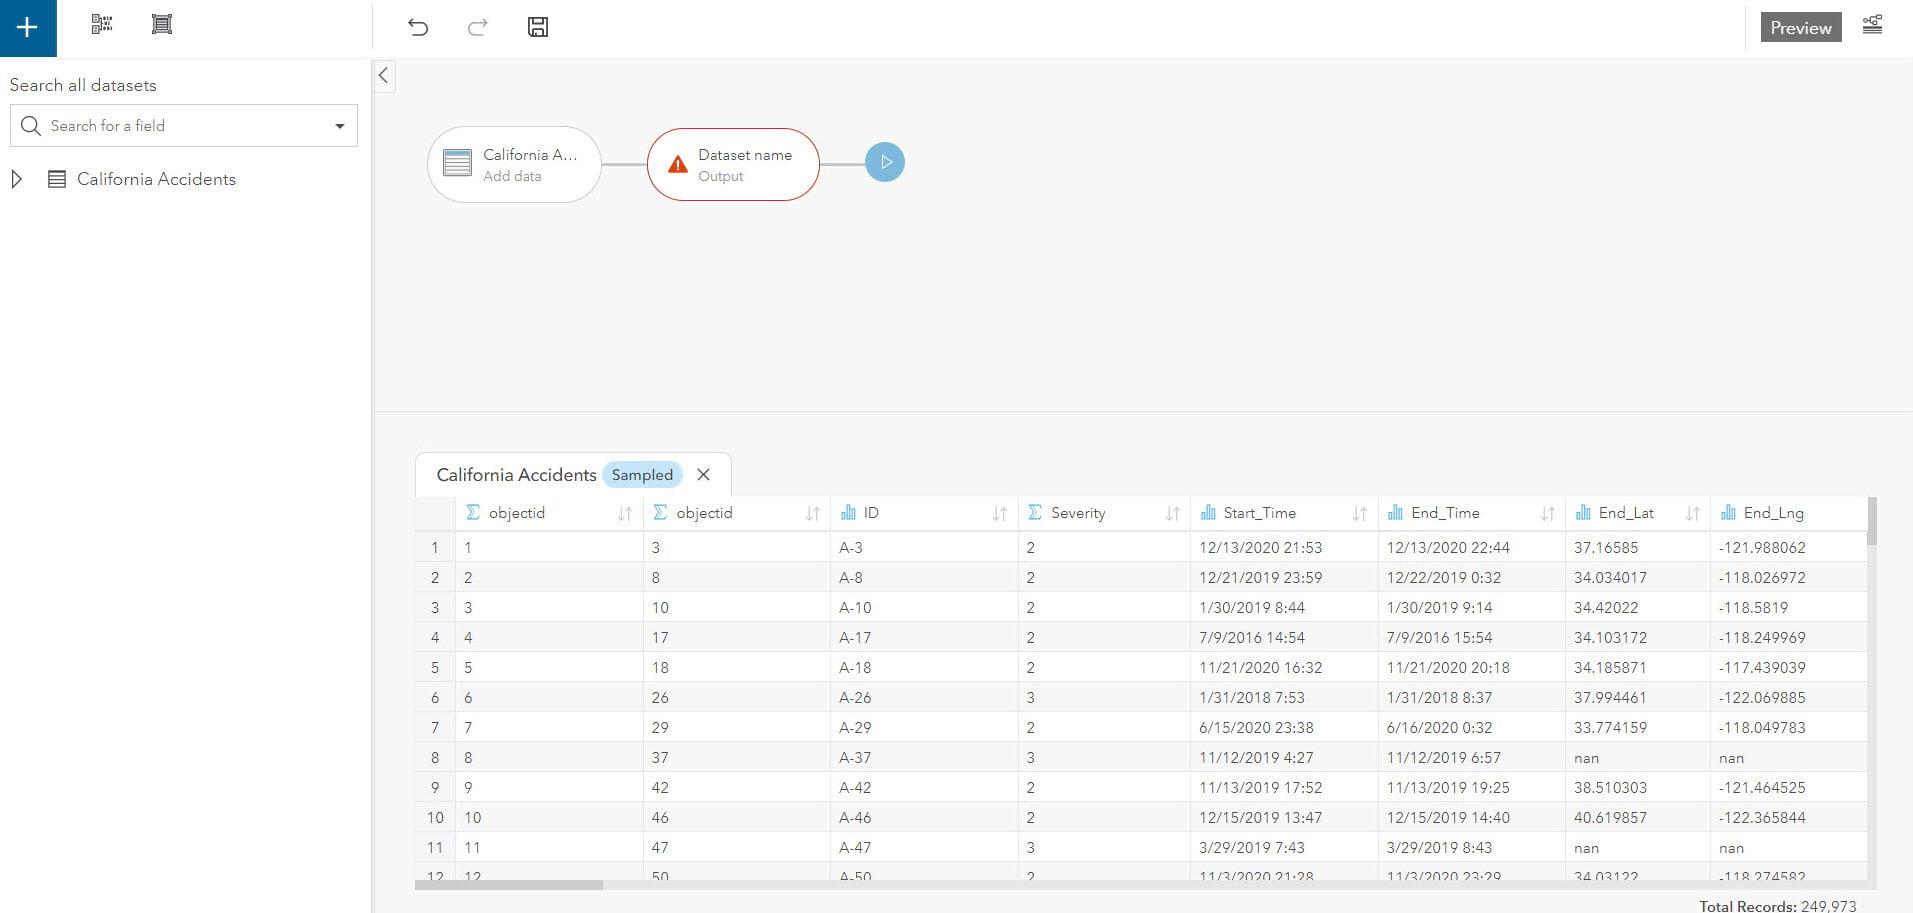
Datasets will be displayed as a tab in the data table section and, based on the data type, different column tools are available from the dropdown menu to explore your data.
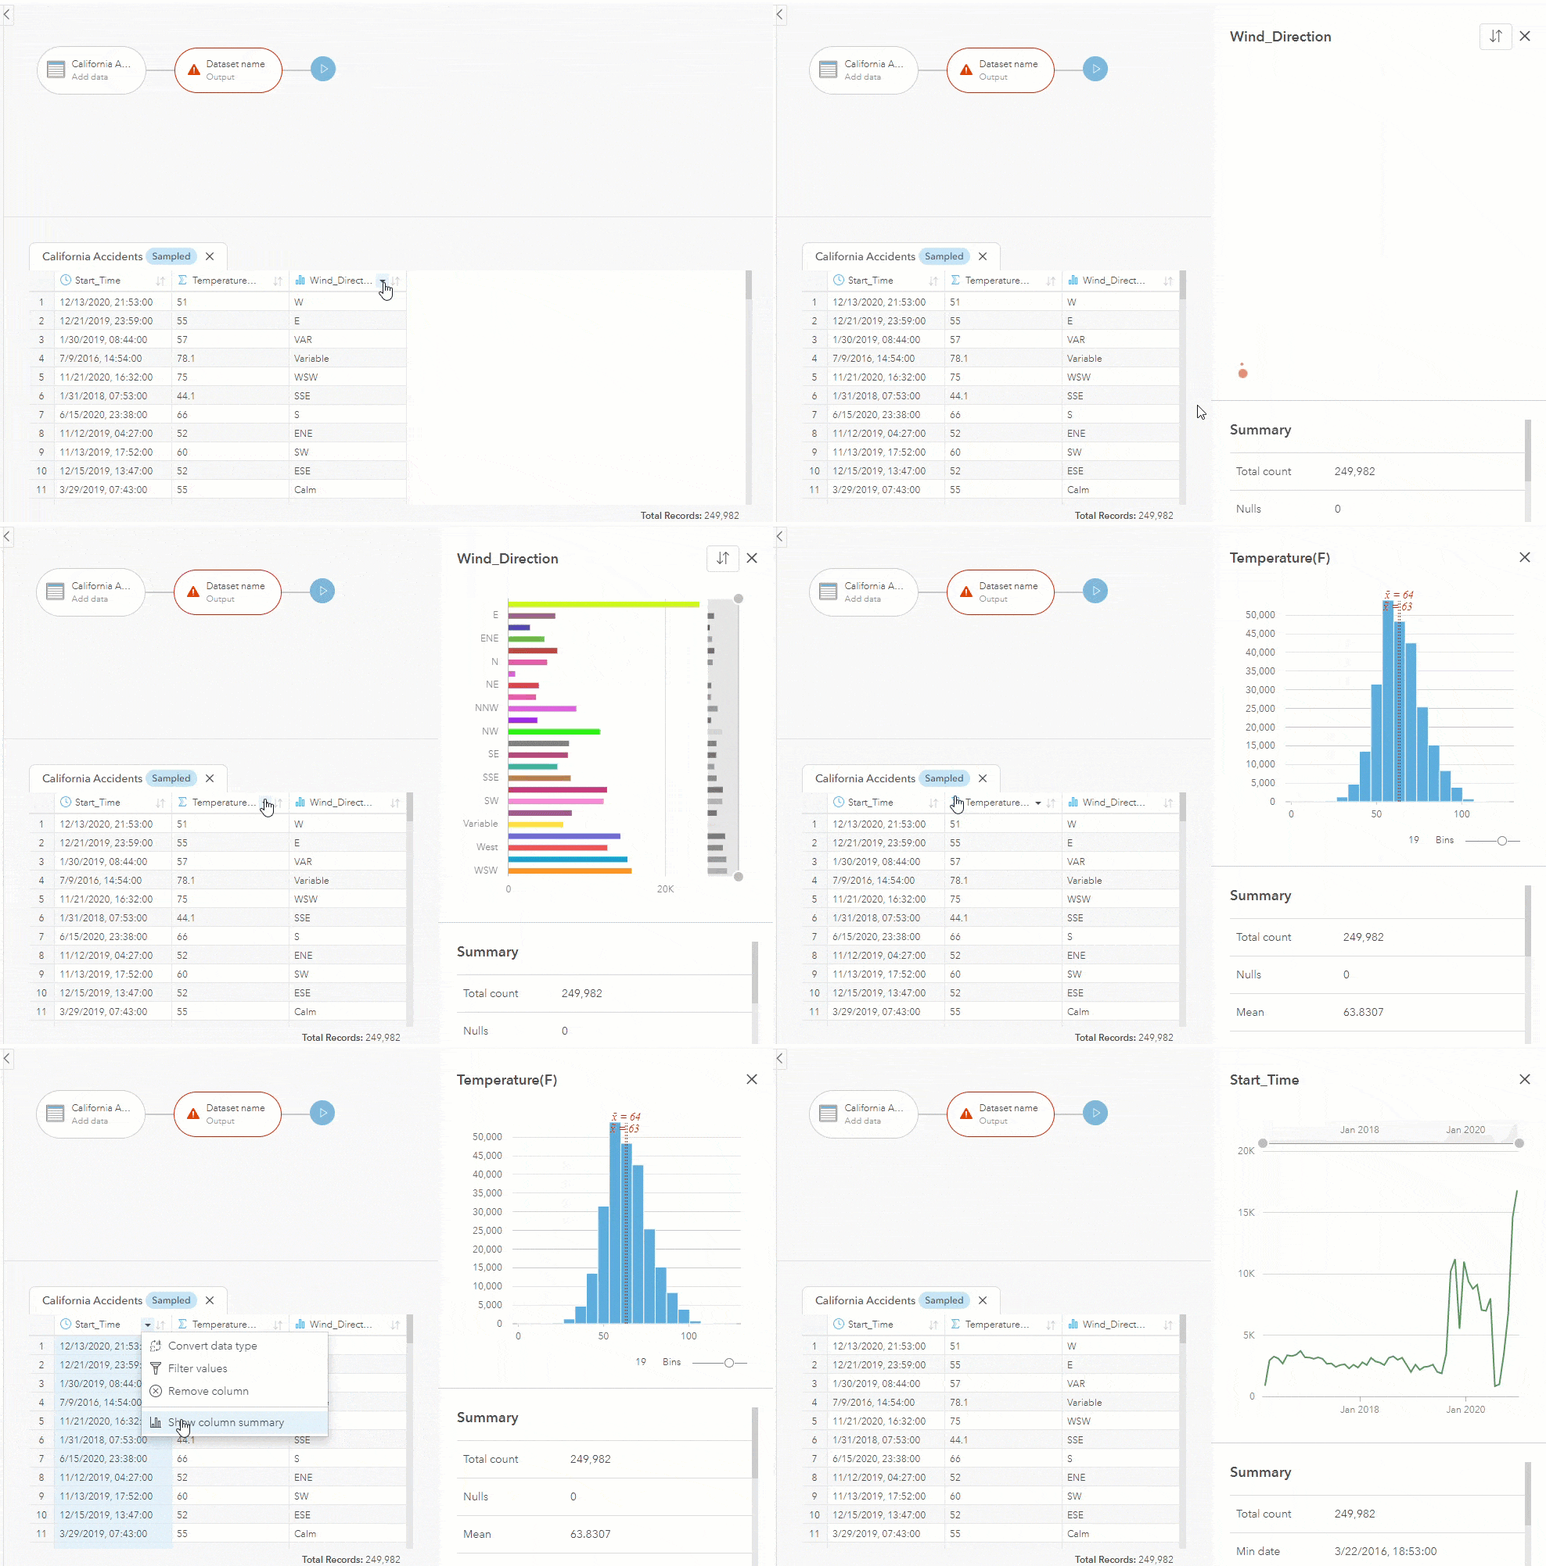
Show column summary shows a chart of the column data. A statistical summary below the chart provides information such as nulls, empty strings, and mean . With the column summary you can obtain more insights about the data to start the preparation process.
Different charts are created, depending on the data type. String columns create a bar chart showing the count of each unique value in the column. Date/Time columns create a time series graph showing the count of features by date or time. Finally, number columns create a histogram showing the distribution of values in the column.
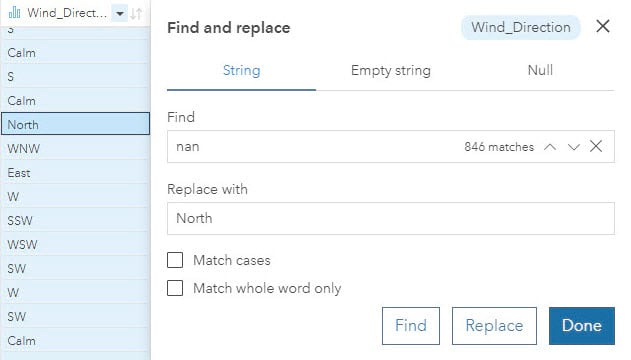
After seeing the data distribution, you may want to fix incorrect values, and this can easily be done with the Find and replace tool. Replace those incorrect spellings, nulls, and empty strings.
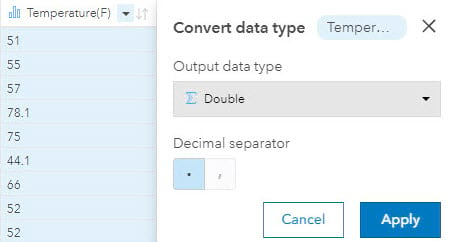
In addition to changing column values, the column data types can be changed. For example, the temperature in a dataset may be showing as string format and converting it to a double will mean you can perform statistical analysis on it.
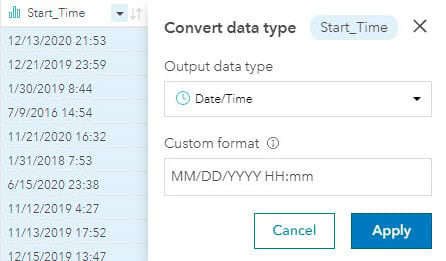
In data engineering you have even more control when converting data types. Date/time accepts custom formats that match your data. In the custom format parameter box, enter the format of your data.
Numeric data types can be integers (no decimal places) or double (decimal places), and you can choose the decimal separator (points or commas).
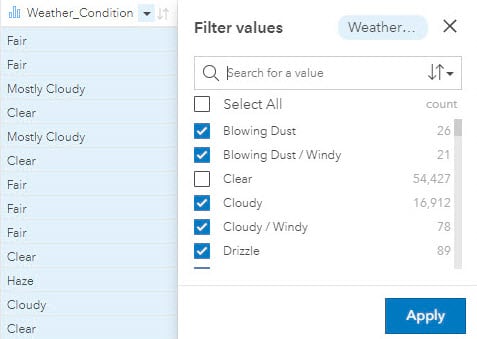
The Advanced filter and the Column filter can be used to limit your data to just the records needed for your analysis.
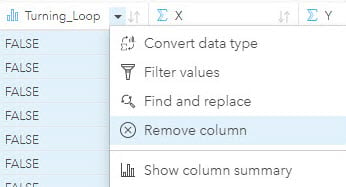
In addition to removing columns on import, you can also remove them in the workbook. As with Insights workbooks, new columns of data can also be calculated.
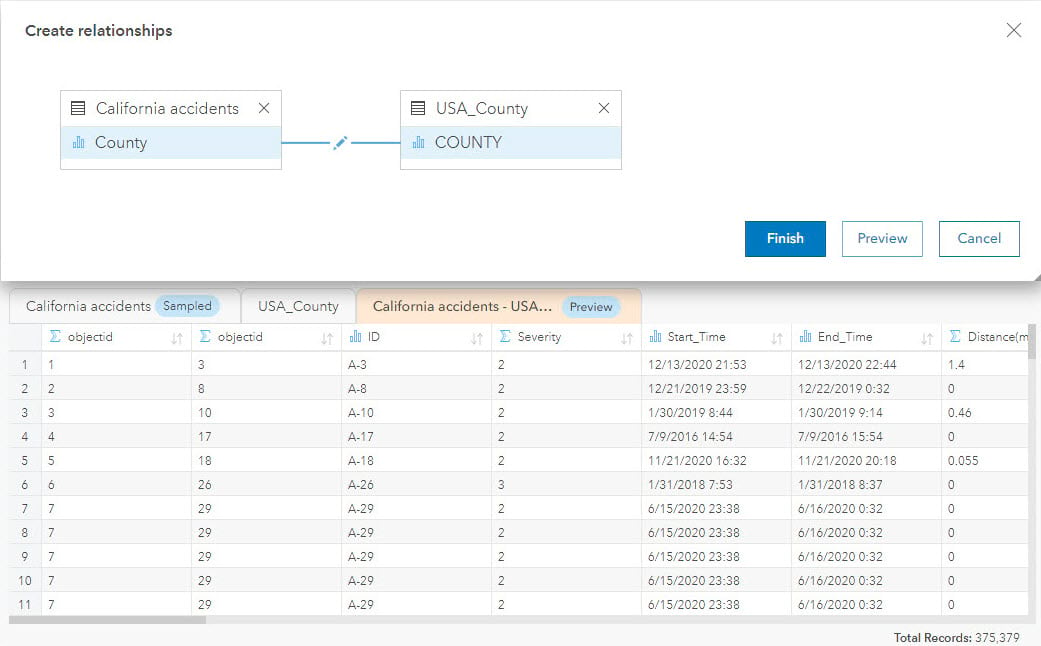
The Create relationships dialog box has been revamped and now supports cross-database joins. Results of the relationship can be previewed before it is run.
If you make a mistake or just want to make changes to your model, you can always edit the model tools to either remove (Delete button) or change the criteria used (Edit button).

Creating the output dataset
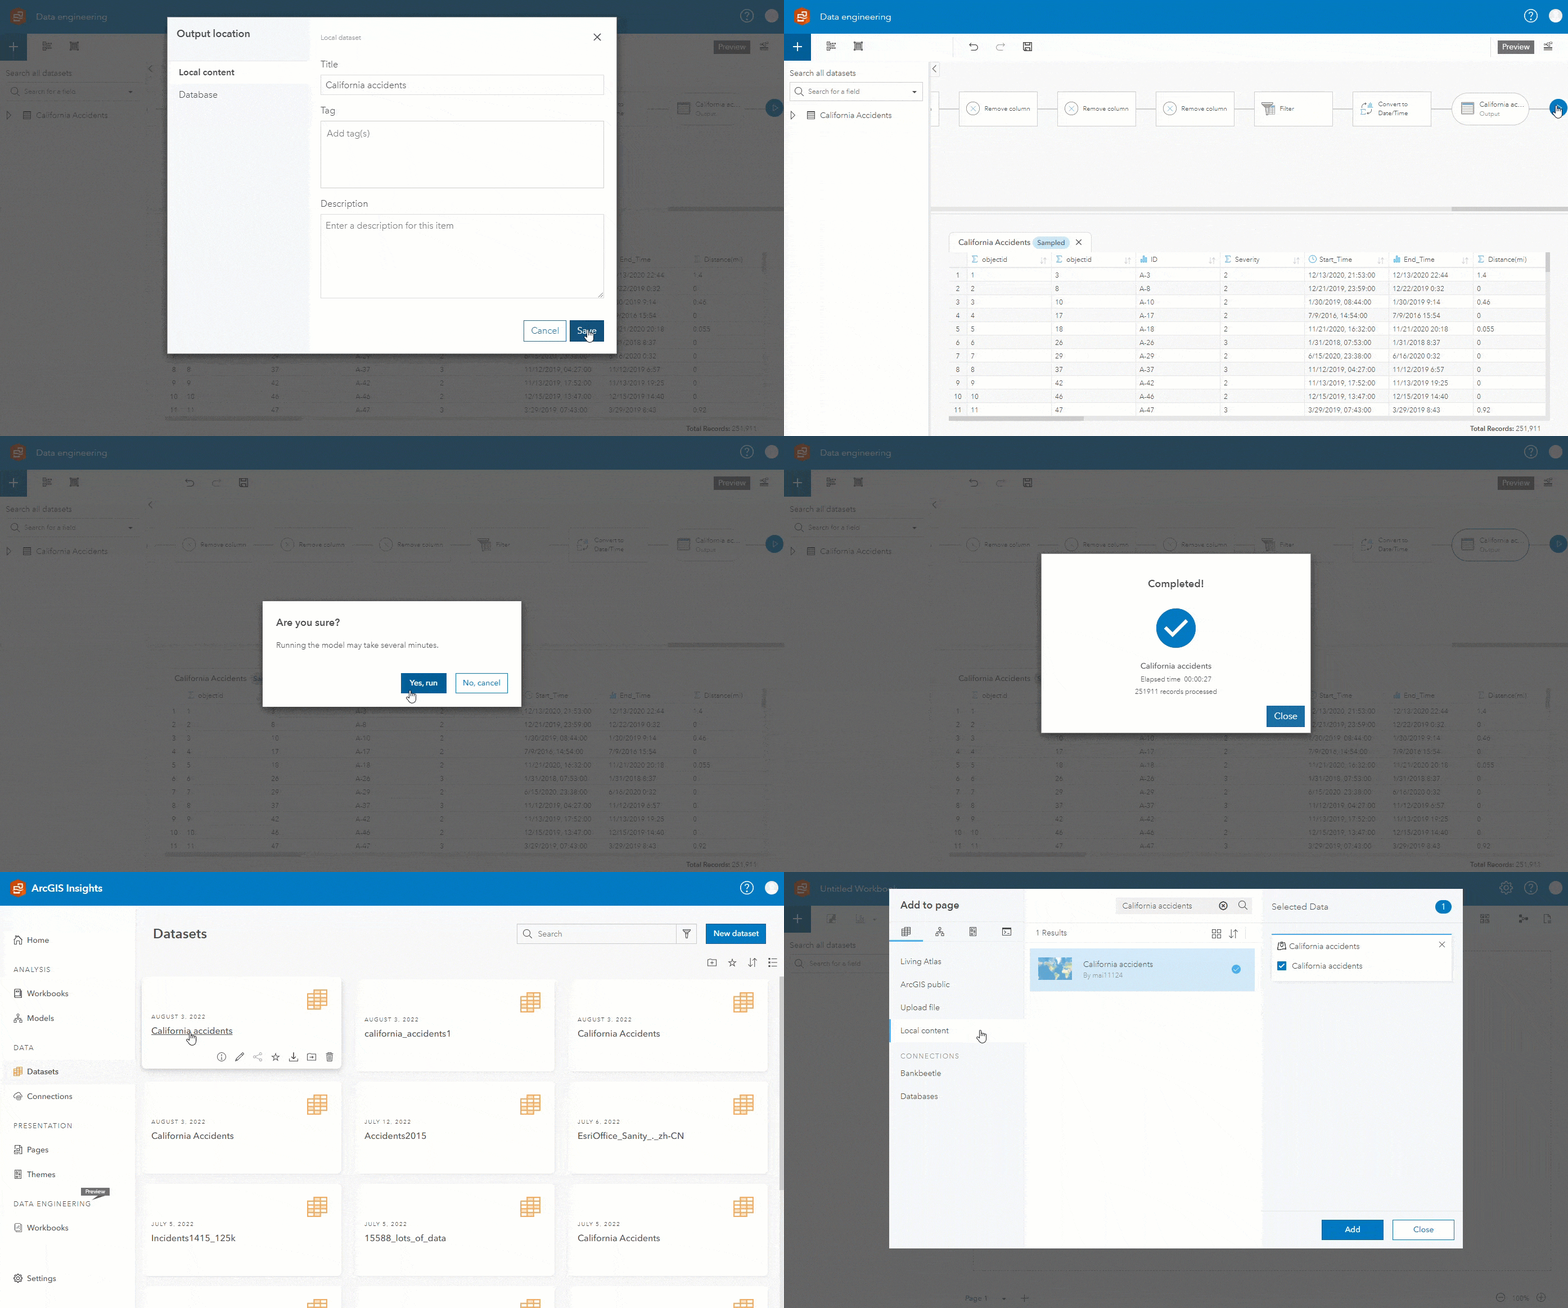
Having cleaned and prepared your data, be sure to run the model to create your new dataset, ready for analysis. Output data can be stored locally or in a database. Local datasets can be exported to CSV, shapefile, and GeoJSON files.
The data engineering preview in ArcGIS Insights 2022.2 offers you new ways to manage your data and a glimpse into the types of features that will arrive in future releases.
If you’d like to learn more, check out the documentation that describes this new feature in detail.


Article Discussion: