Summary: how to build a 3D demo app used for participatory planning in a few simple steps using the ArcGIS API for JavaScript. A live version of the app together with the source code are both available on GitHub.
Joining the 3D ArcGIS API for JavaScript team, my first task was to build a demo web application for participatory planning, engaging citizens in urban planning processes. Wikipedia describes participatory planning as a technique to consider the views of all involved parties. Besides harmonizing the urban planning process, citizen engagement is also characterized by the fact that ordinary people do not have the skills to use professional planning tools. An app that provides participatory planning therefore must be relatively simple to use.
Even if the anticipated app would only serve for demonstration purposes, I was excited to build an app that essentially performs crowdsourcing through a 3D user interface.
At the same time, it daunted me what it means to create an app allowing the user to sketch within a 3D space. Having not done anything alike before, I wasn’t sure how much effort it would take to create an interface that was self-explanatory and efficient to use. In the end a participatory planning proposal should take roughly 10-15mins to create.
To my relief using the latest sketching capabilities of the ArcGIS API for JavaScript, the main features were straightforward to implement. In the following paragraphs I want to share my experiences implementing the participatory planning app, especially the different ways a user can place objects in a 3D scene.
For the demo application we decided to use a neighborhood in Dumbo, Brooklyn NY, an area that is currently undergoing multiple redevelopment projects (see this or this article). Please note that the app and the code examples below are written in TypeScript.
Preparing the area
Participatory planning usually takes place in cities where a predefined lot is being redeveloped. Space is dense and to make the proposals more meaningful we would like to show the surrounding buildings. Luckily many cities like New York provide 3D buildings as open source data. Being available as a SceneLayer on ArcGIS Online we can go straight ahead and import all buildings into our web scene.
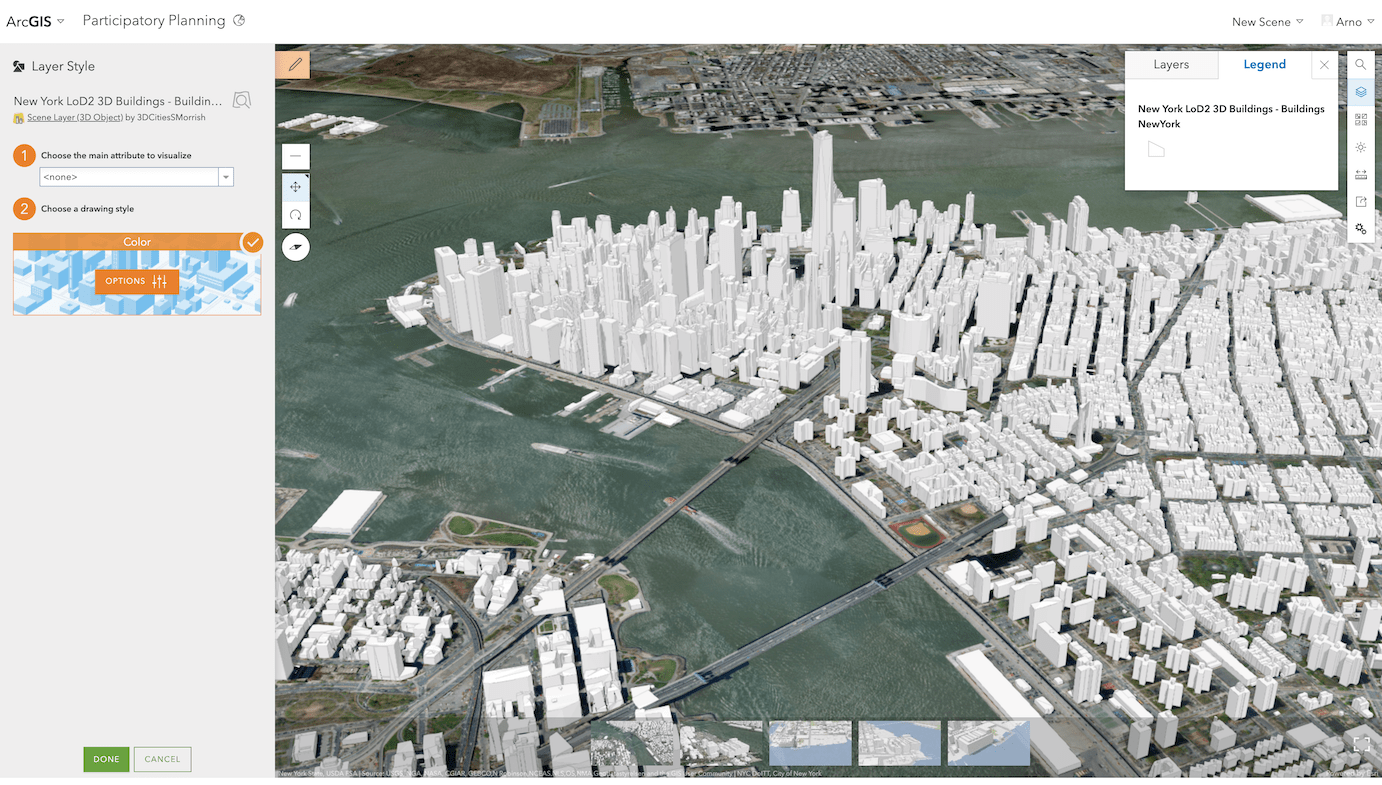
Now the only issue is that we also have buildings where we want to have our users create new proposals. One of the features of ArcGIS API for JavaScript release 4.11 is the ability to spatially filter features on the client based on a given geometry.
As we will see, it would be relatively simple to allow the user to define this area themselves by drawing a Polygon. In most cases however, the redevelopment site is predefined and proposals created by users should be restricted to that area.
Because of that, the Polygon confining the area is hardcoded in the application. We pass it directly to a FeatureFilter on the layer which will hide any buildings inside the geometry.
// Coordinates of predefined redevelopment area
const planningArea = [
  [-73.9845647, 40.7037208],
  [-73.9799378, 40.7035781],
  [-73.979259, 40.7048104],
  [-73.9789216, 40.7062514],
  [-73.9864537, 40.7056929],
  [-73.9864922, 40.7044834],
  [-73.9845199, 40.7043917],
];

// Use FeatureFilter to hide everything inside area
const featureFilter = new FeatureFilter({
  spatialRelationship: "disjoint",
  geometry: {
    type: "polygon", // autocasts as new Polygon()
    rings: [planningArea],
  },
});
Changing the basemap
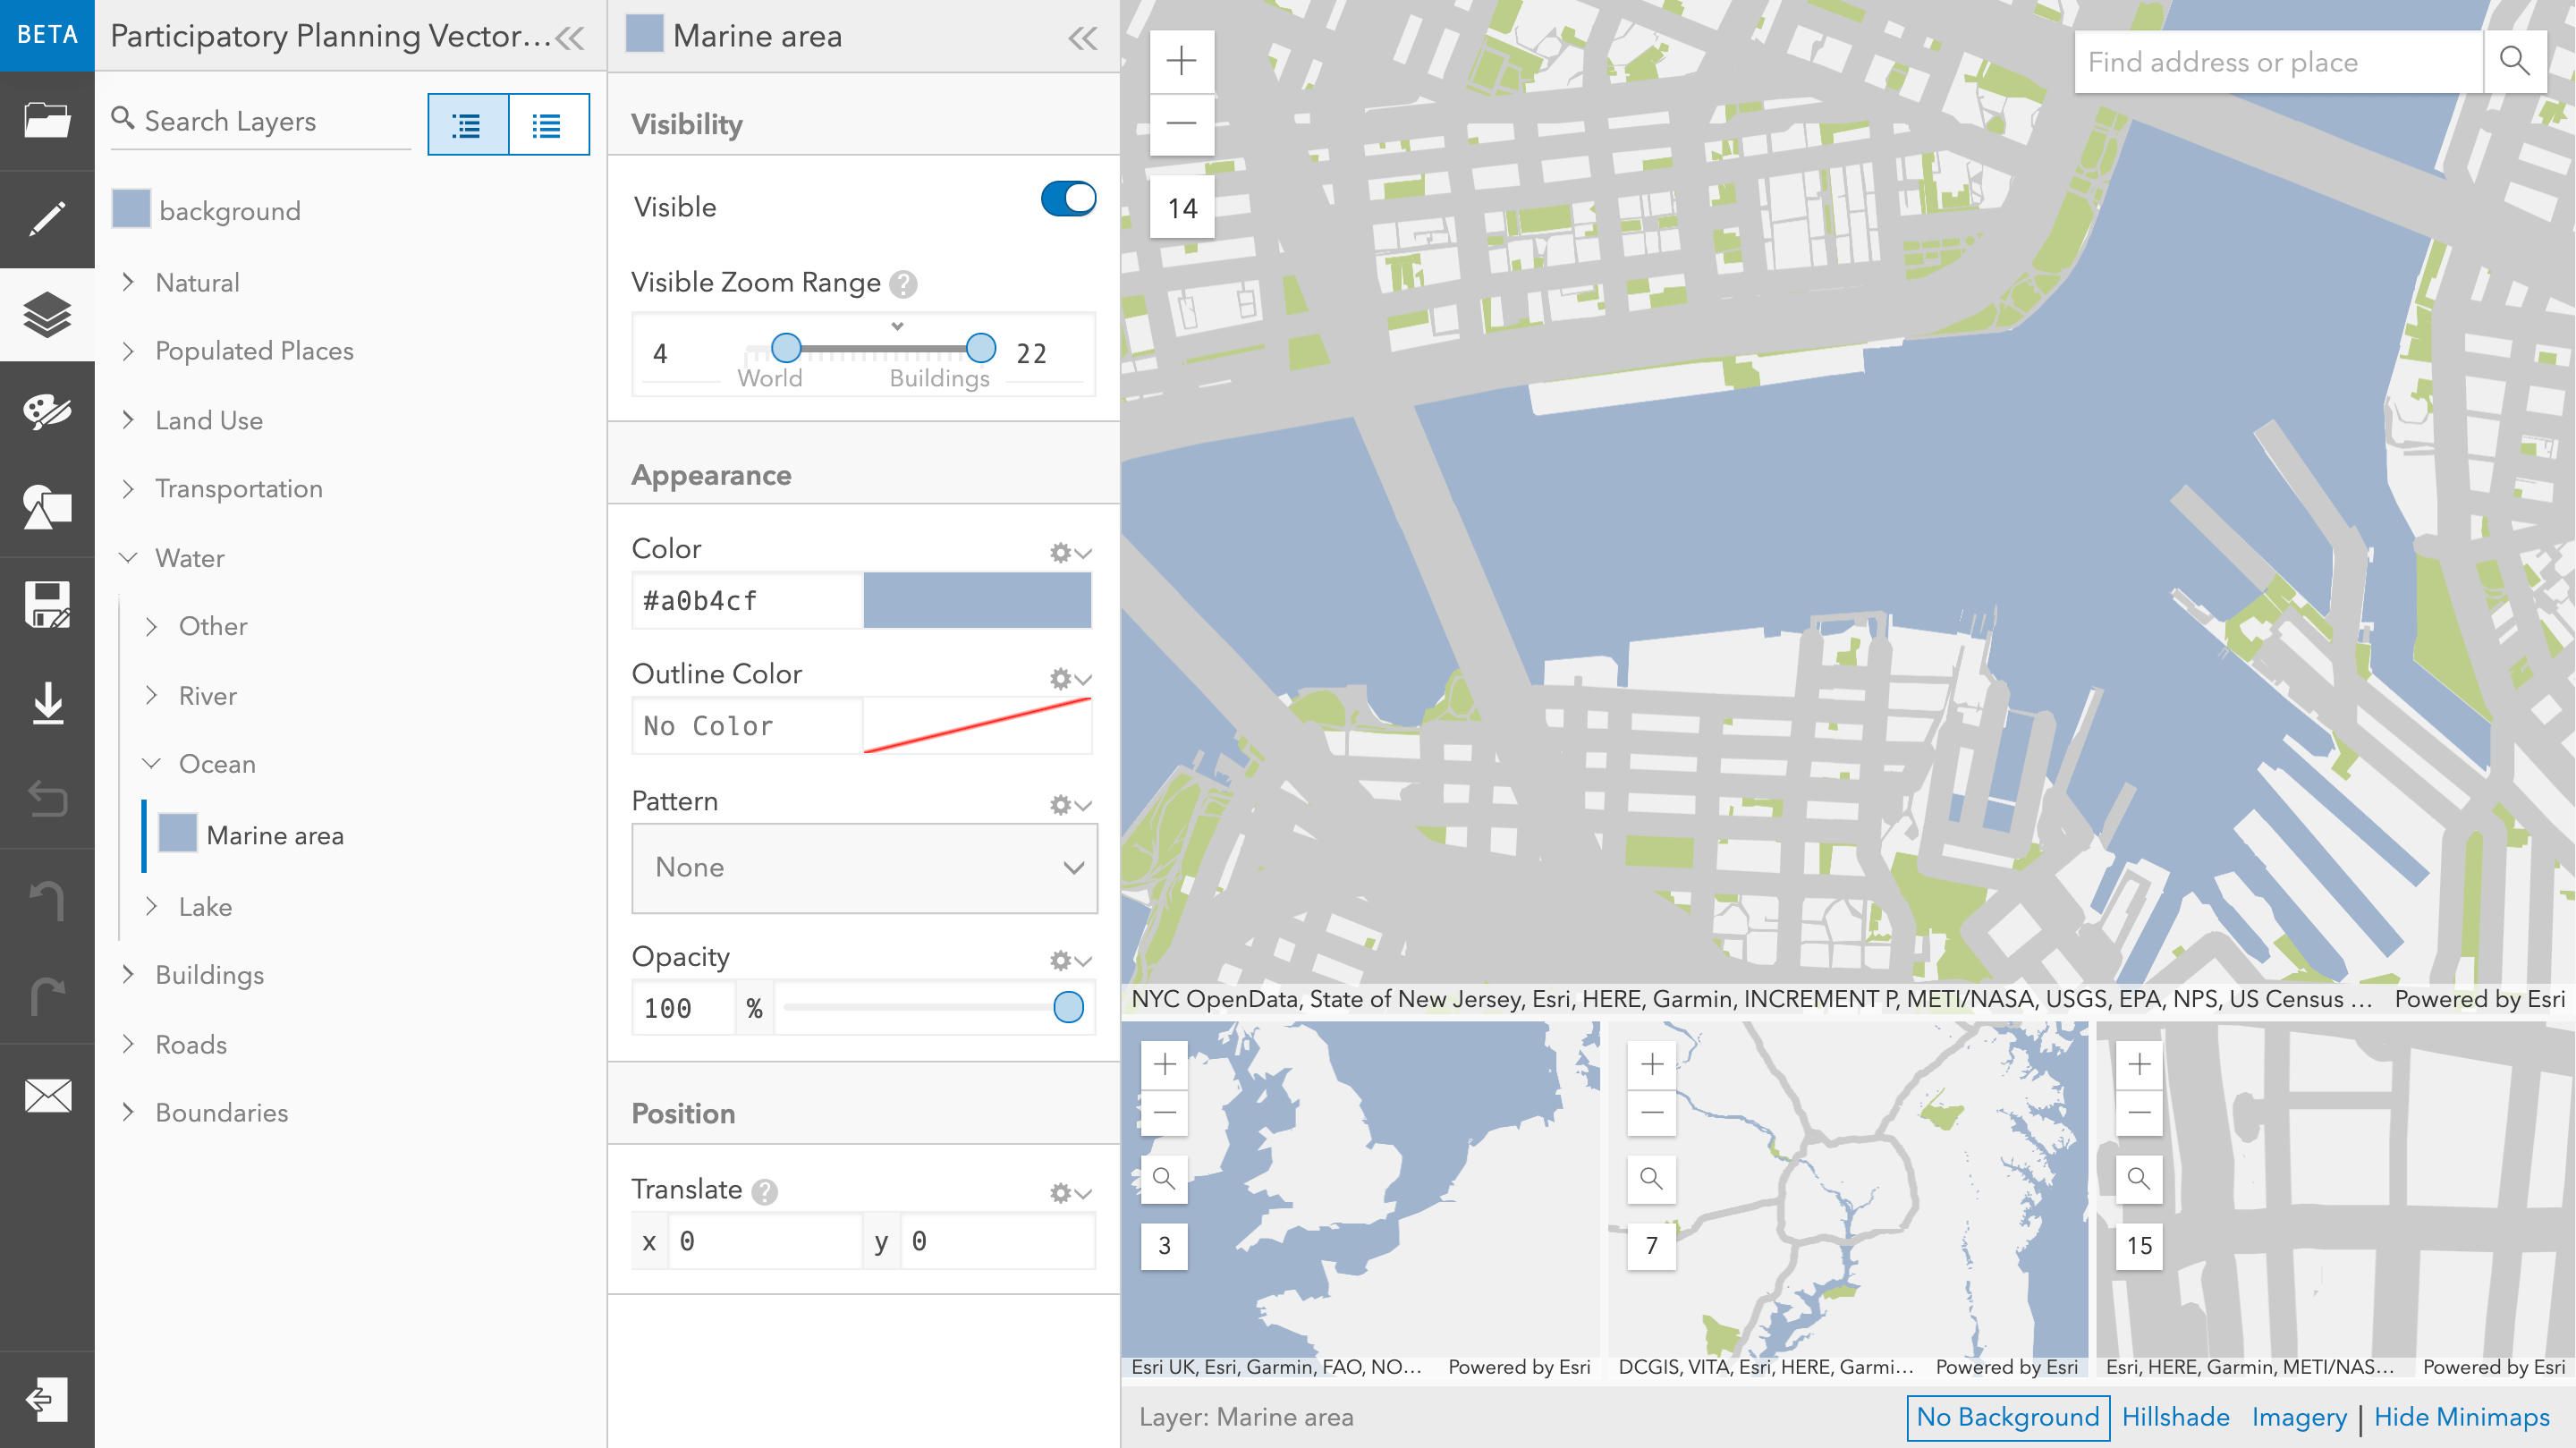
To keep things simple, I decided to create a very simplified basemap for the app. With the help of the new Vector Tile Editor it was possible to create such a basemap in no time. Starting with the basic Light Gray vector-based tile layer, I mapped every type of feature to one of the following ground types, each having a distinct color: land, parks, water, streets and walking paths.
Having an empty lot with a simple basemap, it’s time we allow anyone’s creativity free rein coming up with a proposal plan. To start with, it would be nice if users could change features on the basemap. When a neighborhood is redeveloped, it’s common to create new green space while laying out streets or walking paths from scratch.
This is where we will apply the new 3D drawing capabilities of the SketchViewModel for the first time. As we will see, drawing basic geometries on the ground is straight forward. By applying custom symbols matching the colors of the basemap, it instantly feels like we are changing the basemap.
For streets we use a gray Polyline:
// Tell new SketchViewModel which layer to use
// for drawing
const sketchViewModel = new SketchViewModel({
  layer: graphicsLayer,
  view: view
});

// Create gray polyline for streets
sketchViewModel.polylineSymbol = {
  type: "simple-line",  // new SimpleLineSymbol()
  color: "#cbcbcb",
  width: 20,
};
sketchViewModel.create("polyline");
While for parks, lakes or concrete ground we use a Polygon:
// Create green polygon for lawn
sketchViewModel.polygonSymbol = {
  type: "simple-fill",  // new SimpleFillSymbol()
  color: "#bdce8a",
  style: "solid",
  outline: { width: 0 },
};
sketchViewModel.create("polygon");
Because we are essentially trying to change the ground layers with this, it’s important to draw the new graphics on a GraphicsLayer having elevation mode “on-the-ground". With this setting graphics are draped onto the underlaying elevation layer.
Creating buildings
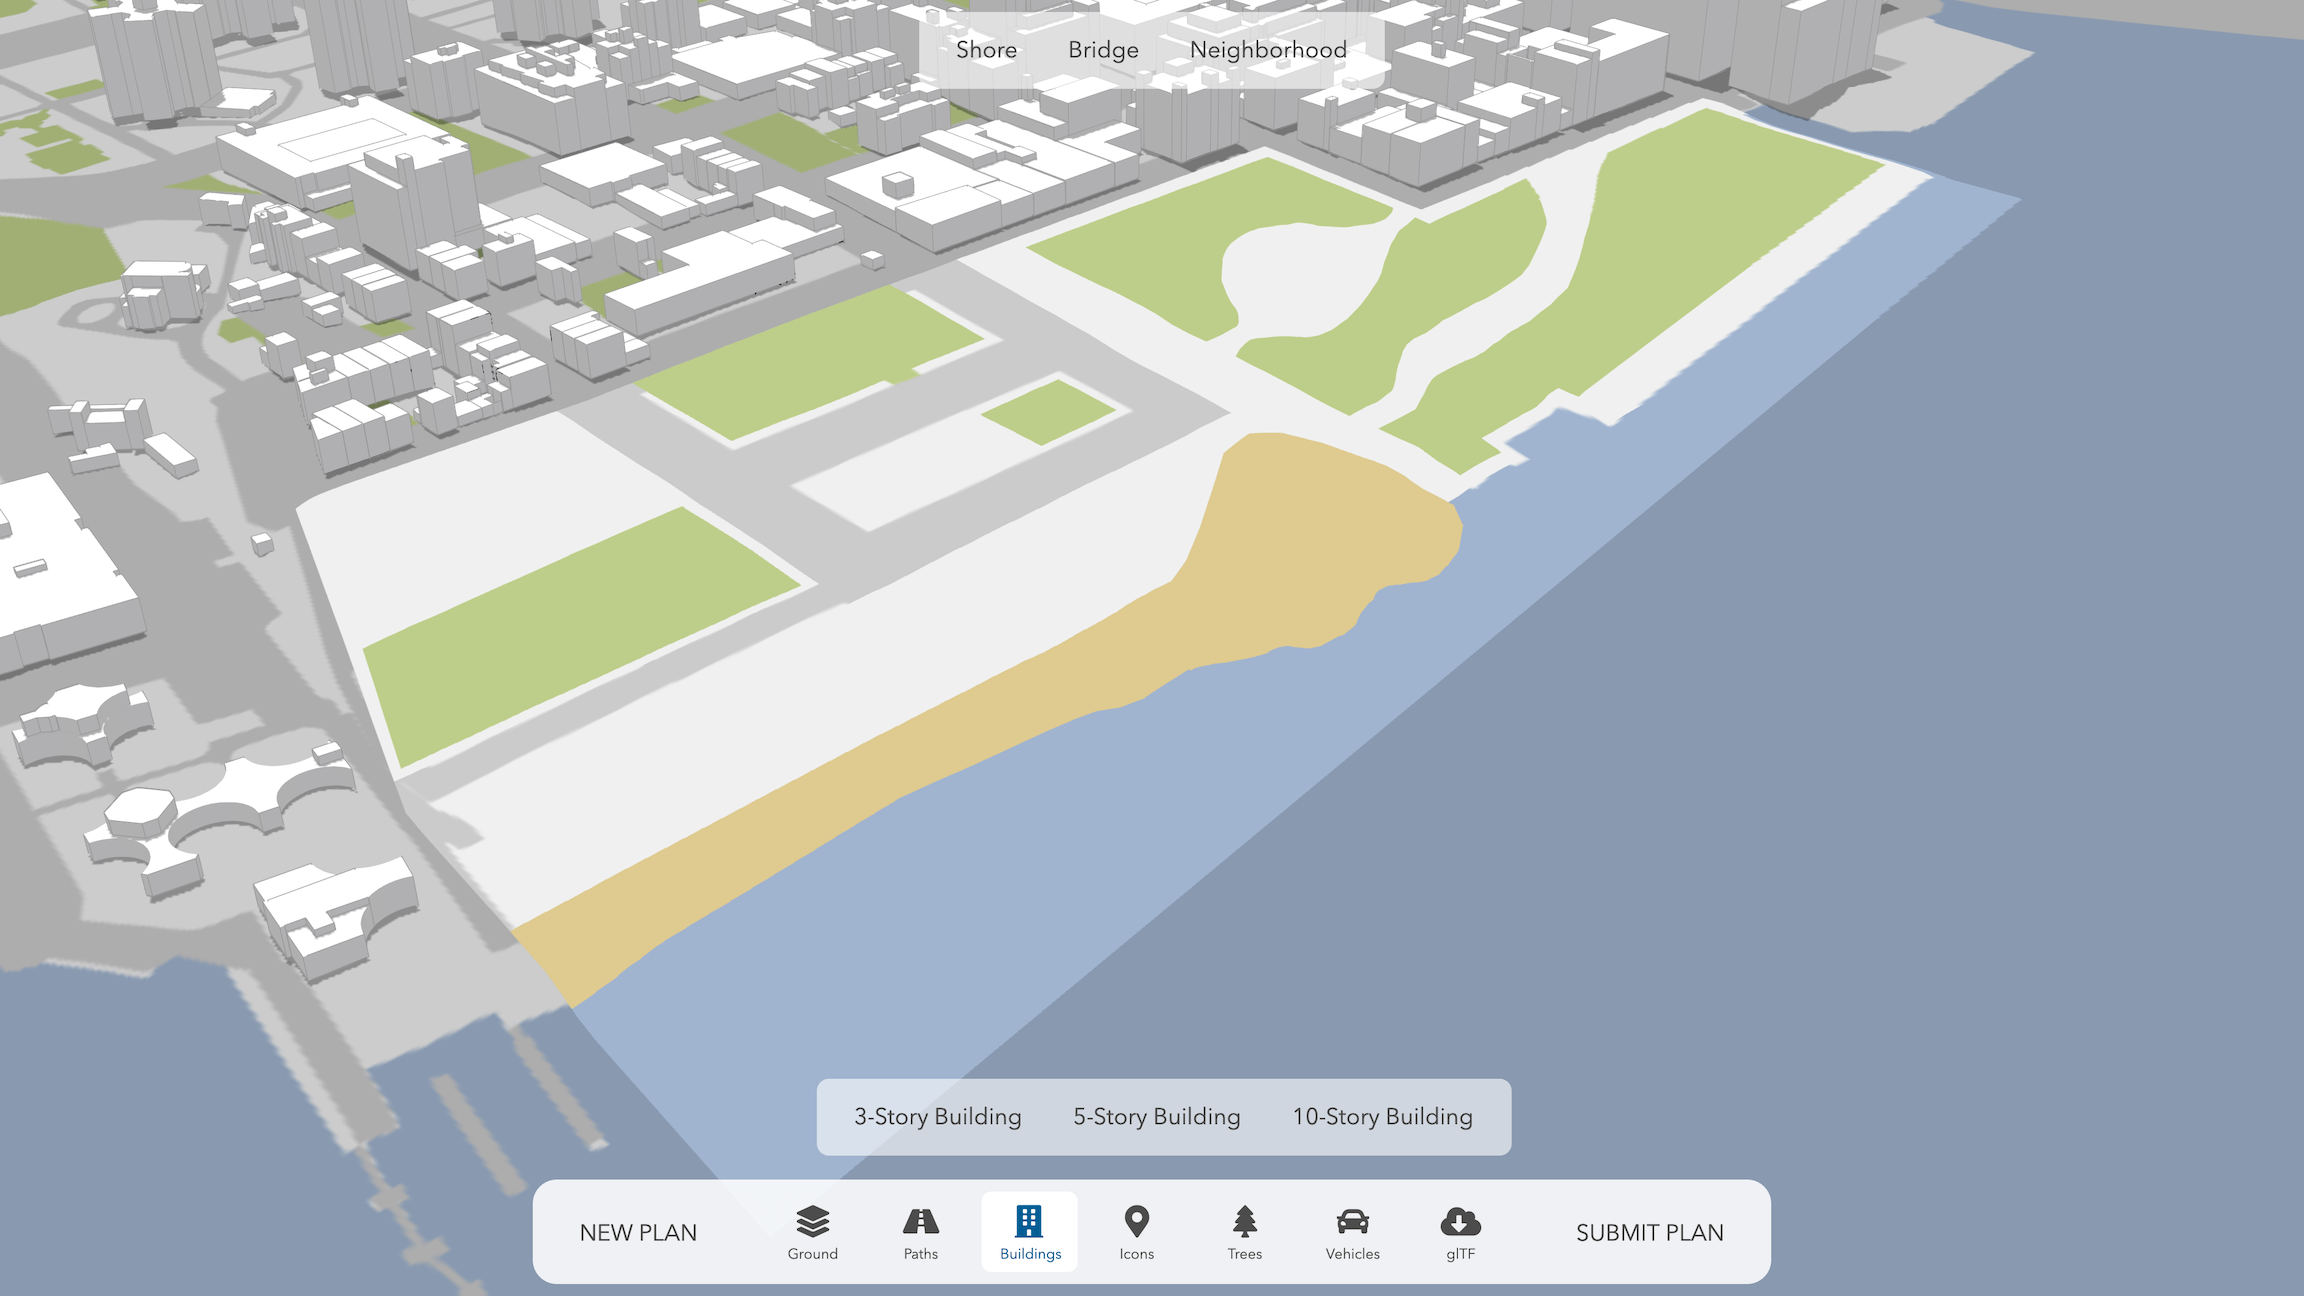
The next thing any user would probably want to do at this point is place a few buildings. Because anyone should be able to use a citizen engagement app, we want to keep the options simple while allowing for creativity. Given that it seemed like a good compromise to allow arbitrary footprints while restricting the building heights to three different numbers of floors: 3, 5 and 10.
Going from drawing ground in the previous paragraph to drawing buildings is as simple as applying an extruded symbol to the graphic used in the SketchViewModel. The extrusion height is taken from the selected number of stories multiplied by a constant.
// Create buildings with extruded symbols
sketchViewModel.polygonSymbol = {
  type: "polygon-3d", // new PolygonSymbol3D()
  symbolLayers: [{
    type: "extrude", // new ExtrudeSymbol3DLayer()
    material: {
      color: "#FFFFFF",
    },
    edges: {
      type: "solid", // new SolidEdges3D()
      color: "#646464",
    },
    size: numberOfFloors * 3, // 3 meters floor height
  }],
};
sketchViewModel.create("polygon");
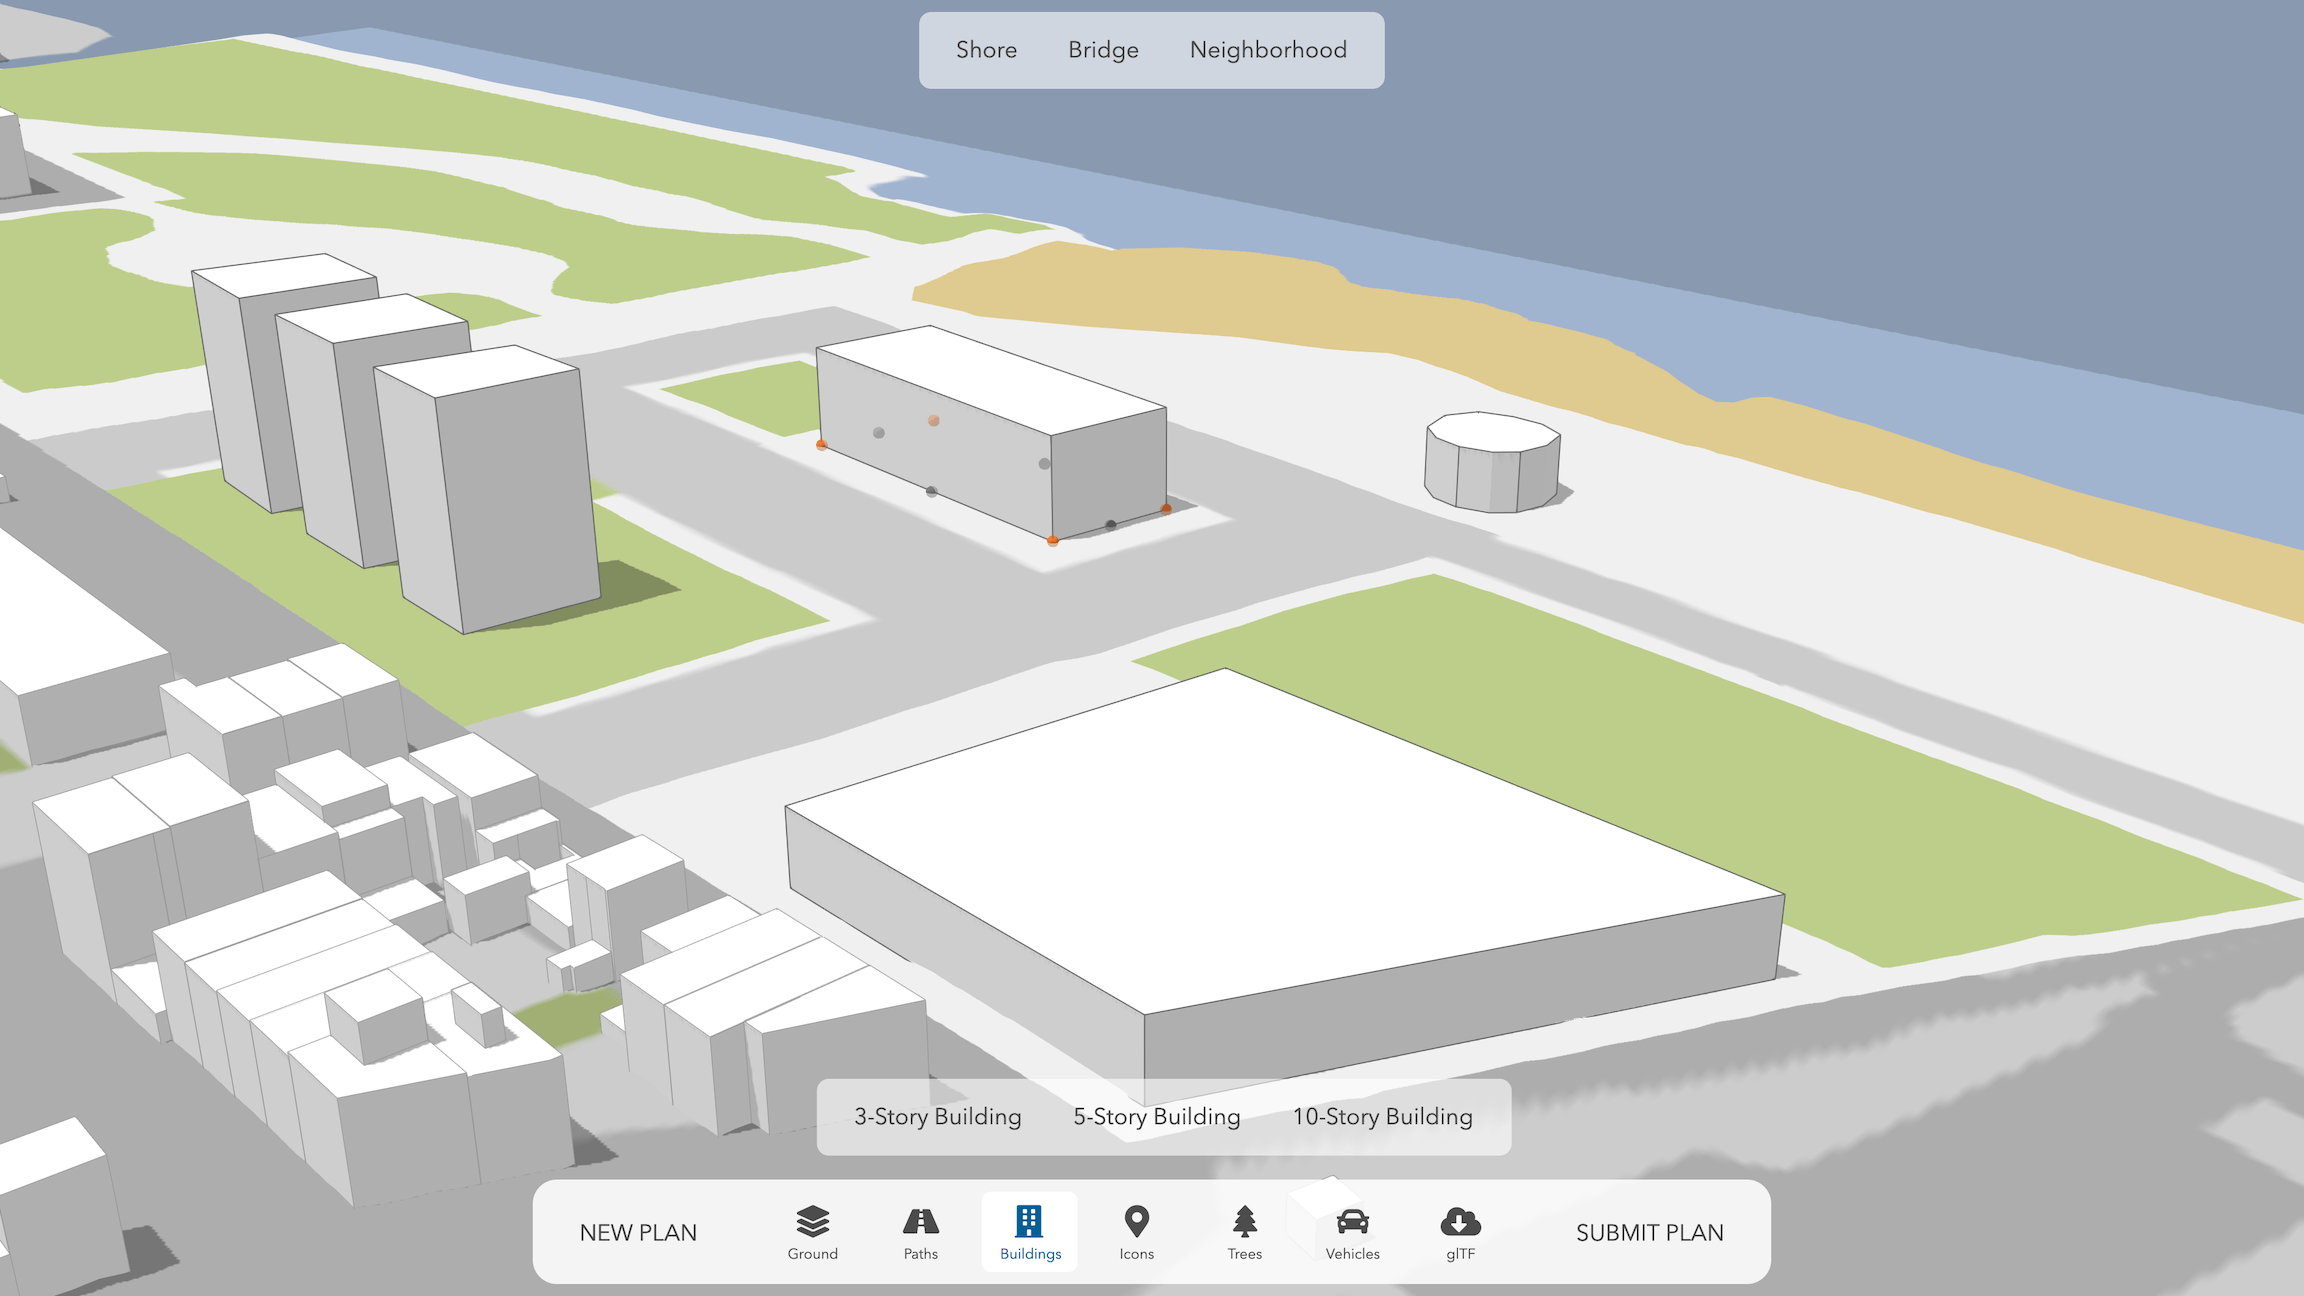
Any instantiated SketchViewModel actively listens to click events on the map. When selecting a graphic on the associated layer, the SketchViewModel will initiate an update action and provide manipulators for each vertex of the selected graphic. That way the user can modify the shape, but also remove and add vertices.
Placing realistic symbols
While the resulting plans are a good start and serve as a sketch, we would still like to place 3D objects to make the plan look more realistic. Esri maintains a gallery of 3D models as web style symbols. It provides a set of common objects such as trees, vehicles, street signs etc.
However, with release 4.11 of the ArcGIS API for JavaScript, using your own glTF models in a scene has become straightforward. If they are available online, you can import them simply by providing the corresponding URL. The API will then take care of downloading and rendering the model.
In the Participatory Planning app we integrated the SketchFab widget providing a gallery of freely available glTF models. When the user selects a model, the widgets passes control back to the app together with a link to download the 3D model and place it into the scene.
// Add graphic with symbol layer pointing to glTF model
const glTFModel = new Graphic({
  geometry: {
    type: "point", // new Point()
    x: 40.7, // longitute
    y: -73.9, // latitude
  },
  symbol: {
    type: "point-3d", // new PointSymbol3D()
    symbolLayers: [{
      type: "object", // new ObjectSymbol3DLayer()
      resource: {
        // URL of glTF model
        href: "https://developers.arcgis.com/javascript/latest/sample-code/import-gltf/live/tent.glb"
      }
    }]
  }
});
graphicsLayer.add(glTFModel);
Please note that glTF models are sometimes provided as ZIP archives. In that case it is necessary to unpack and load them as a blob object before passing them to the API. Check out the source code to see how this can be done directly in the Browser.
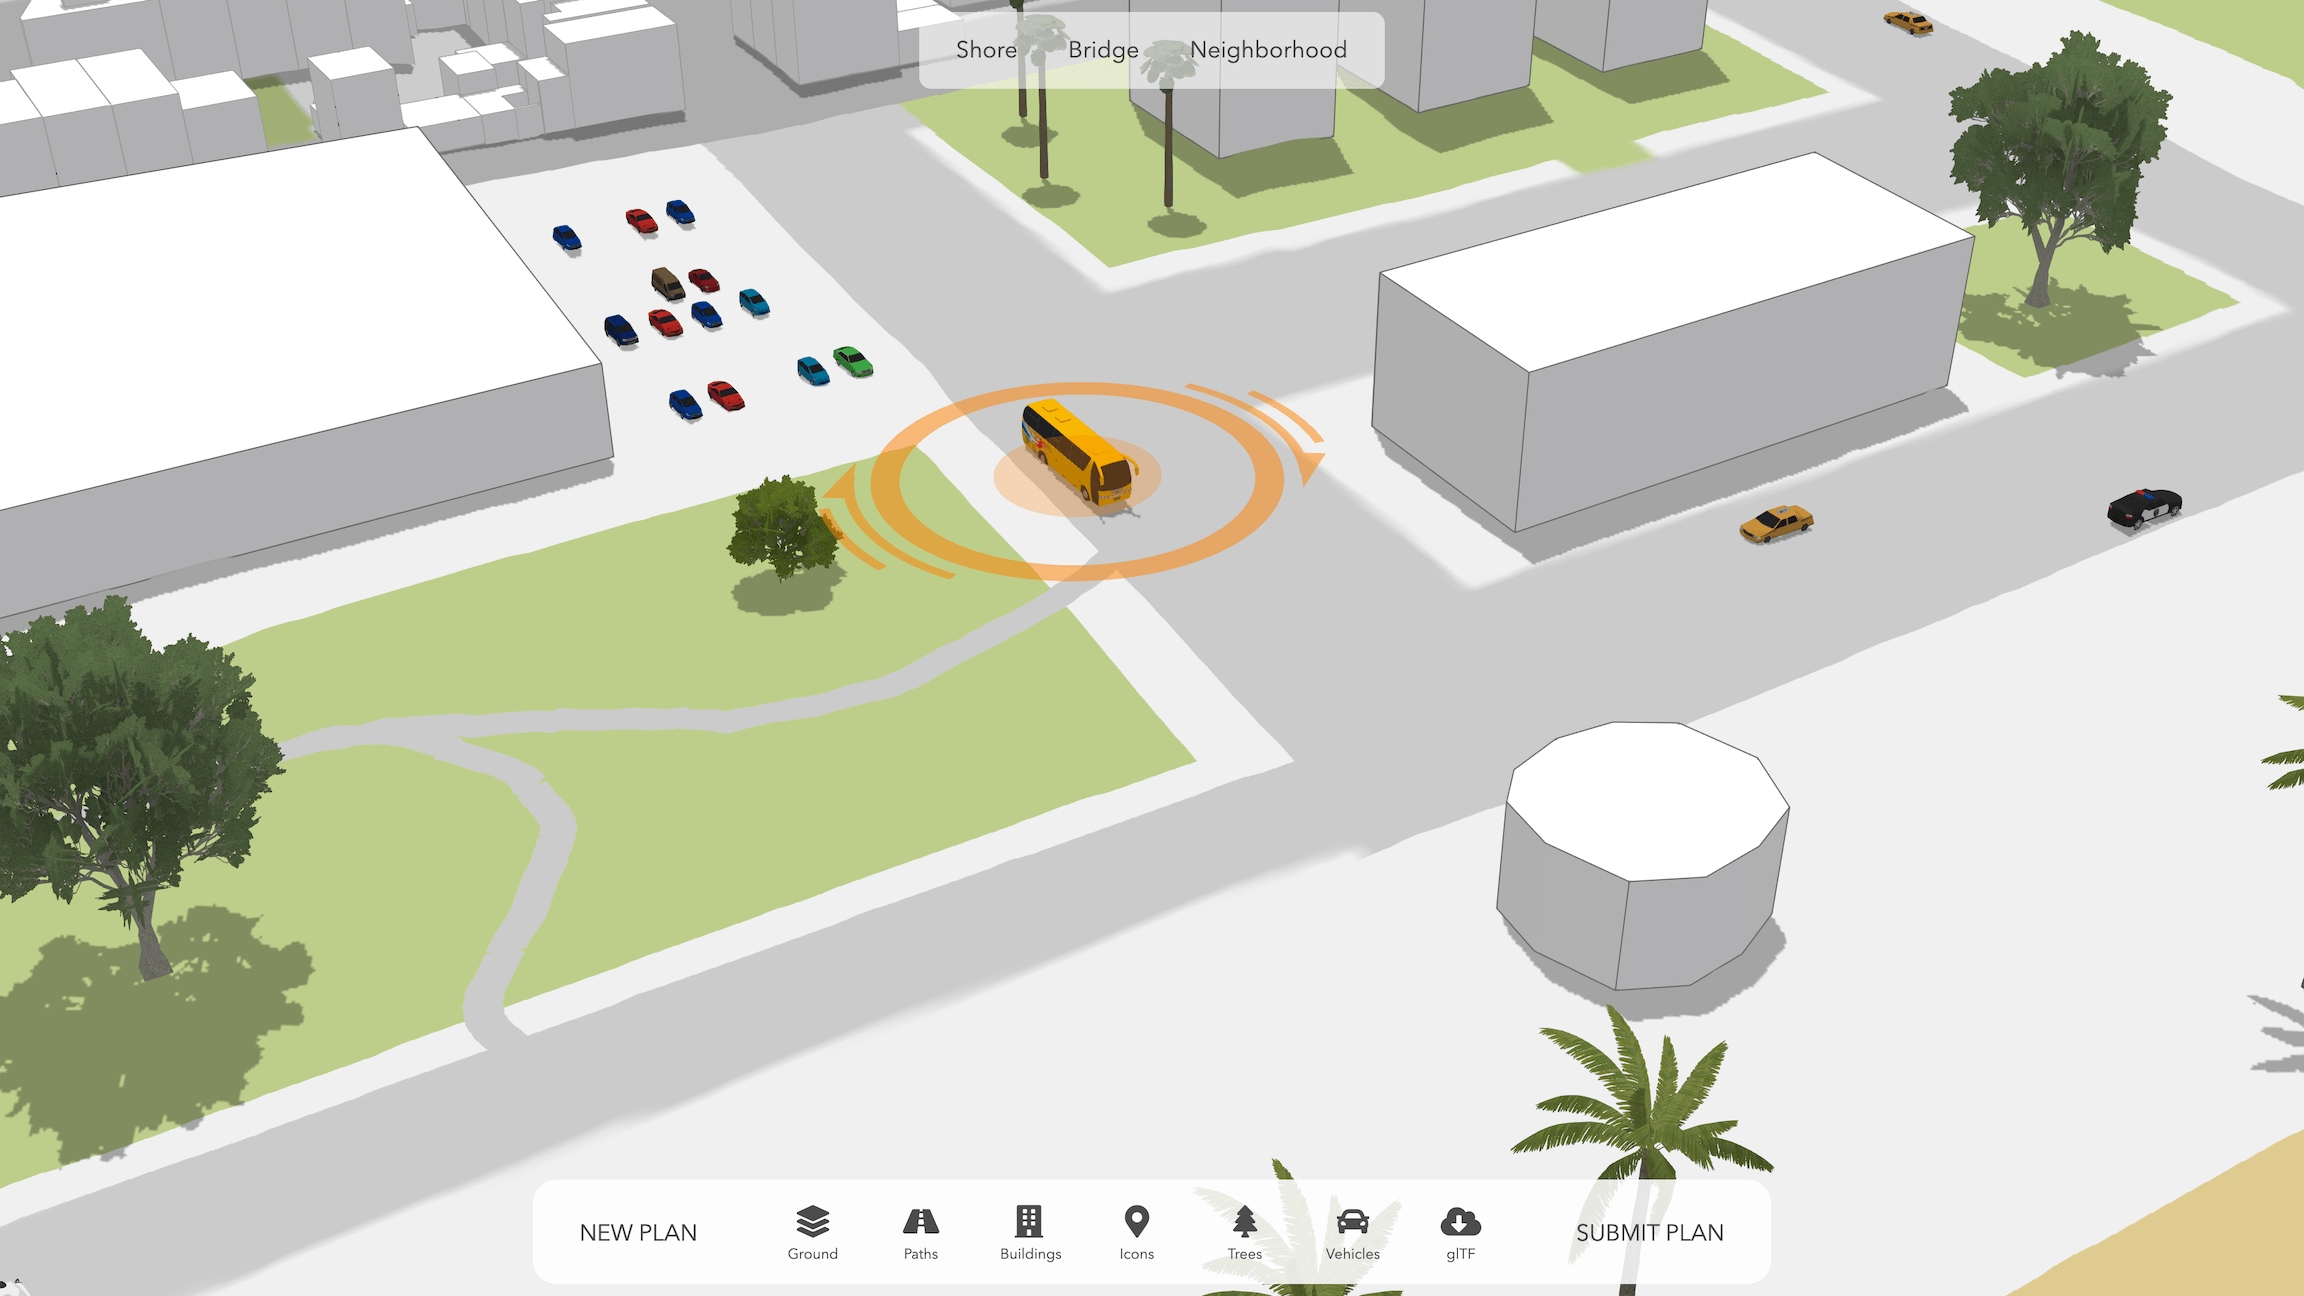
As we have seen in the previous code example, 3D symbols are placed into a scene using point graphics. While the position is defined by a point geometry, size and orientation can be changed on the symbol layer. This is where the new SketchViewModel really shines: clicking on the 3D model it automatically adds a transform tool allowing the user to intuitively place the 3D object in the scene.
// After adding the glTF model, use the
// SketchViewModel to place it in the scene
const sketchViewModel = new SketchViewModel({
  layer: graphicsLayer,
  view: view,
});
sketchViewModel.update(gltfModel);
Submitting a proposal
How a proposal in the end is then submitted depends a lot on how they are evaluated. One might want to have a dashboard with all proposals to get an overview. In countries like the U.S. where it is mandatory to take each citizen feedback into account, it would probably make sense to equip the submissions with text and collect them in an issue tracker.
For simplicity we decided to create a snapshot using the screenshot API. Besides the user-created sketch, we also take a snapshot of what the area looks like today. This is accomplished showing the satellite basemap using the same perspective. Combining both screenshots together we get a nice before/after view of the area:
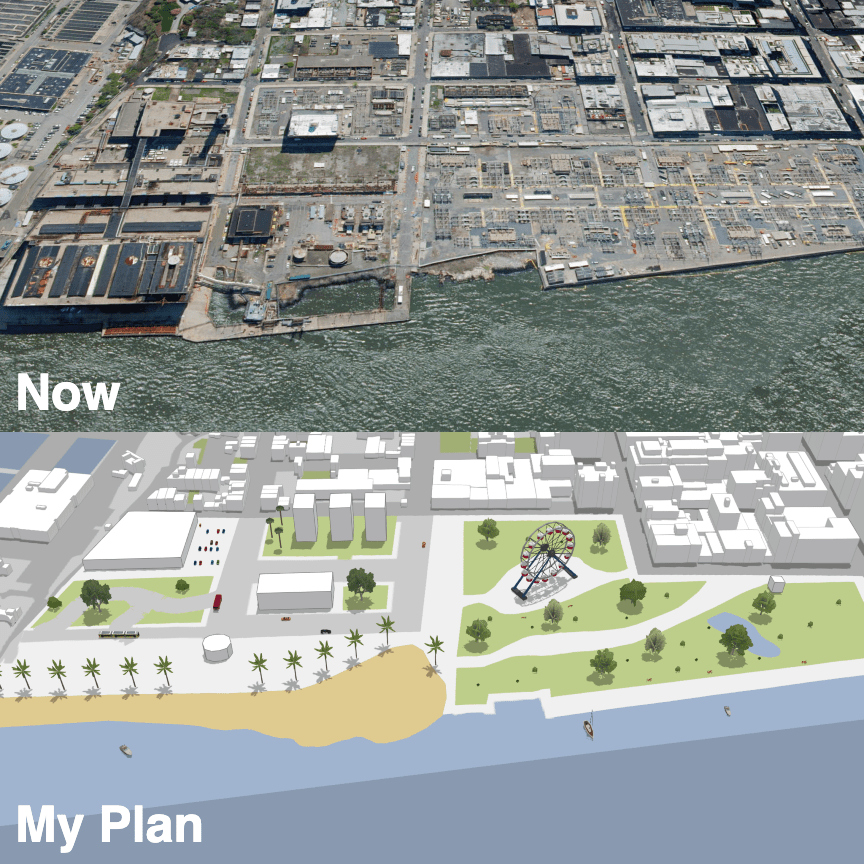
As already pointed out above, the app is available on GitHub as a live version and source code. Feel free to try it out and reuse it as a starting point for your own projects. By changing the settings and adding your own web scene, you can define other areas for Participatory Planning.
I’m looking forward seeing some proposals you have created! And of course I appreciate any feedback on the app or blog.

Commenting is not enabled for this article.