Some months ago I worked with John Nelson on an interactive 3D globe and the project turned out really nicely, so I’ve written a blog post that shows how to create this globe using ArcGIS API for JavaScript.

John Nelson worked with Vizzuality on the Half Earth project and in that process he created a basemap prototype that we’ll use in this tutorial. You can read all about it in his blog post (or as John would put it, don’t read it!). For the globe we were inspired by the Half-Earth globe as well as this beautiful virtual globe and this awesome hand-crafted globe. In this blog post we’ll show you step by step how to create this interactive 3D globe:
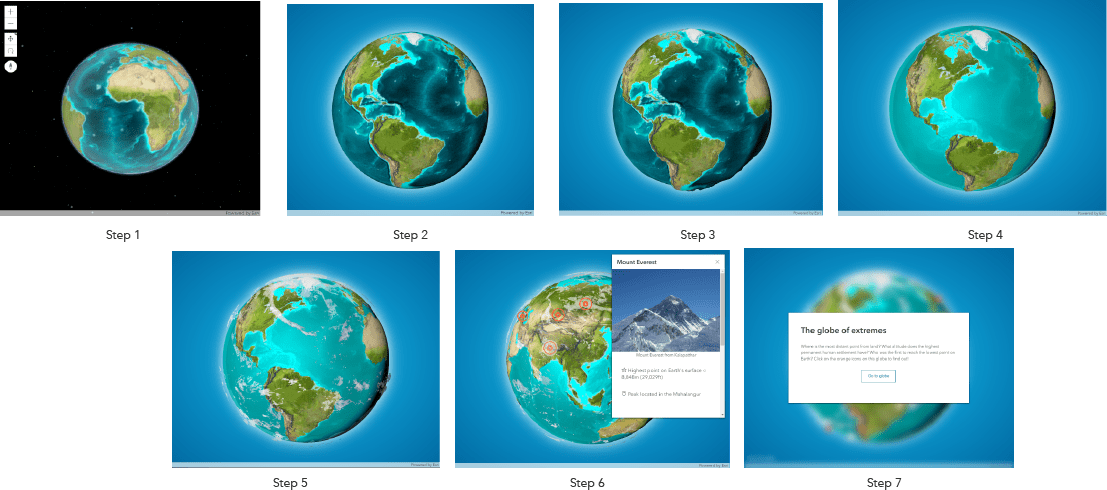
Before we get started with the tutorial, the repository for this app is here and each commit corresponds to one step in the tutorial. Click on “see the code” to see the corresponding commit on Github.
Step 1: where we create a globe with a custom basemap
We start off with a basic setup: we have an HTML page where we initialize a Map and a SceneView that renders the map. Additionally, in the CSS page we set the map container to cover the whole screen.
The important part here is adding the TileLayer that John created as part of the basemap:
const basemap = new Basemap({
  baseLayers: [
    new TileLayer({
       url: "https://tiles.arcgis.com/tiles/.../MapServer"
    })
  ]
});

const map = new Map({
  basemap: basemap
});

Step 2: where the globe starts looking fancy
After the first step the globe has a very realistic background and for our app I’d like to give it a playful look that will invite users to explore the data on the globe. For that, we’ll remove the stars and the atmosphere and we’ll add a custom background gradient on the body: background: radial-gradient(#12bff2,#0269a1);. We’ll also set altitude constraints so that the user can’t zoom in or out too much to avoid that they get lost.
Another change that we’ll make to the globe is adding some CSS filters to increase the saturation and additionally we’ll add a white halo around it: filter: saturate(1.5) drop-shadow(0 0 20px white); .

Step 3: where we exaggerate… the terrain
In this map we’ll show the highest and the lowest points on Earth, but with the real elevation values you can barely see any changes in the terrain height. To solve that, we’ll exaggerate both land and ocean surface elevation. We’ll use the Topobathy elevation service provided by Esri to have access to world elevation data.
With this technique, the 3D perception of terrain increases considerably as we exaggerate the elevation:

Exaggerating the elevation layer can be done in the API by extending the BaseElevationLayer. In the fetchTile() method we multiply the elevation of each data value with the exaggeration value. After playing around with several values we decided on 60 times larger for values above 0 meters and 40 times smaller for values below 0 meters.
function fetchTile(level, row, col) {
  return this._elevation.fetchTile(level, row, col).then(
    function(data) {
      for (let i = 0; i < data.values.length; i++) {
        if (data.values[i] >= 0) {
          data.values[i] = data.values[i] * 60;
        }
        else {
          data.values[i] = data.values[i] * 40;
        }
      }
      return data;
    }.bind(this));
}

Step 4: where we add a shiny ocean surface
John had this cool idea of adding a glassy, semi-transparent surface as the ocean surface, a bit like in this globe. Currently, specular reflection is supported in the API for GLTF models and for Mesh geometries. So we created a sphere using an utility method called Mesh.createSphere(). Besides the size and the location where the sphere should be placed, we’re also setting the material. A MeshMaterialMetallicRoughness allows us to set the metallic and roughness properties that will make the surface of the sphere look shiny. The sphere also is semi-transparent so that we can see the ocean floor through it:
const origin = new Point({
  x: 0, y: -90, z: -(2 * R)
});

const oceanSurfaceMesh = Mesh.createSphere(
  origin, {
  size: {
    width: 2 * R,
    depth: 2 * R,
    height: 2 * R
  },
  densificationFactor: 5,
  material: {
    color: [0, 210, 210, 0.8],
    metallic: 0.9,
    roughness: 0.8,
    doubleSided: false
  }
});

const oceanSurfaceGraphic = new Graphic({
  geometry: oceanSurfaceMesh,
  symbol: {
    type: "mesh-3d",
    symbolLayers: [{
      type: "fill"
    }]
  }
});

view.graphics.add(oceanSurfaceGraphic);

Step 5: where some clouds show up
Continuing with the experiments, we wanted to add some clouds to our globe. NASA has satellite images of clouds available for public use, so we added a layer of clouds using the Mesh class. Basically we create a sphere with Mesh.createSphere() and we map the clouds image as a texture on the sphere. Of course, the clouds are then not exactly in the place they were when the image was taken, but that is not very relevant for our visualization. We elevated clouds from the globe by adding an offset of 300km to the radius of the Earth and setting this as the radius of the mesh sphere.

Step 6: where we collect and display the extreme points
This was the tedious part of this project: actual data collection. The main resource was this wikipedia article of extreme points on Earth. There’s no magic going on here, after some online research, we manually created a GeoJSON file with the points and loaded it in our app as a GeoJSONLayer. For this globe we need some symbols that stand out, so we created a PointSymbol3D with two IconSymbol3DLayers representing concentric circles. When clicking on an icon a popup shows up, displaying the information stored in the GeoJSON file. We docked the popup in the upper right corner and we applied some custom CSS to style it.

Step 7: where we create the Intro page✨
As an “Intro” page we want to have a message that tells the user what the app is about. The globe shouldn’t be too distracting, so we’re going to blur the globe using a css filter while the intro message is displayed. Once the user clicks on Go to globe the globe starts spinning to show the user that they can interact with it.
In this step we’ll also add an “About” page (which is technically the same as the “Intro” page with different content) to give the user more information about the data and the tools that were used to build this app.

And that’s all there is to it! Have fun exploring our globe and we look forward to see what it inspired you to build!

Commenting is not enabled for this article.