Infographics in Business Analyst allows you to summarize and visualize data and key indicators in a beautiful and interactive way that is easier and quicker to understand. Infographics are customizable to include the data variables, charts, icons, tables, images and branding of your choice to meet your organization needs. If you have your own data, you can use that as well and combine it with Esri Demographics data to display it all together in a single infographic.
For example, let’s say you need to show commercial properties available in an area on a map and allow users to click property locations on the map to show a summary of property information such as lot size, built up area, parking spaces, site pictures, demographic summary and average commercial real estate prices around the property. As a developer, you can do this by building a custom application using the ArcGIS API for JavaScript (JS) that shows infographics summarizing such information for each location.
This blog helps you understand how to use the Business Analyst infographics capability available in the JavaScript API in your custom applications. This capability augments the already available classic reports (e.g. tabular PDF reports) capability. Both of these capabilities are powered by Esri Demographics based GeoEnrichment service.
Business Analyst Infographics in the ArcGIS API for JavaScript
The April 2018 release of the ArcGIS API for JavaScript 3.24 includes the Infographics available in the Business Analyst Web App. Using the ReportPlayer widget in the API, you can add to your application any starter infographic template created by Esri as well as custom infographic templates created by users in your organization.
How Infographics Work in Your Application
Infographics are generated in your application using the following approach:
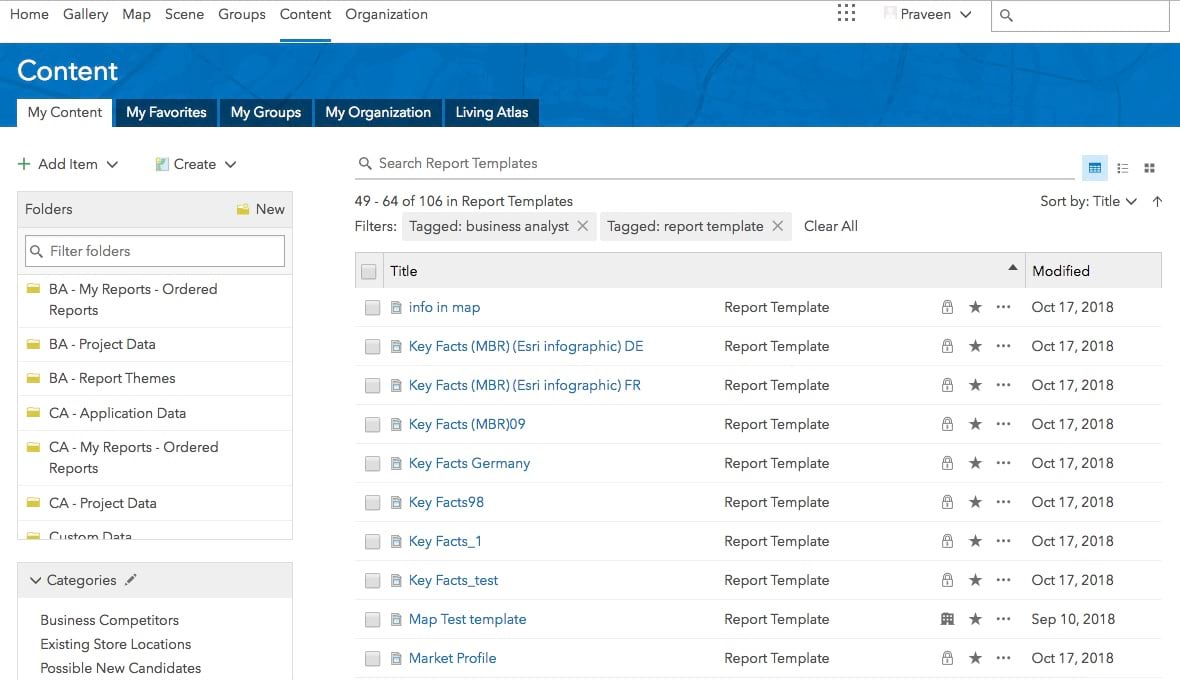
- Use the ReportPlayer widget with a specified Report Template item id. All infographic templates are stored as a Report Template item in your ArcGIS Online or ArcGIS Enterprise portal. These report templates can be one of the starter templates Esri provides, or it can be a custom one you create using the Business Analyst Web Application.
- Specify the area/location for which you want to run the infographics for.
- The rendering of the infographics is done on the client side of the browser through the ReportPlayer widget.
- The server-side support comes from the GeoEnrichment service.
- You can choose to view infographics in full page mode or as slides as well as configure which export options are available to the user on the client side. These options include PDF, image, and Dynamic HTML formats.
Check out a live sample here.
Let’s walkthrough how to use the JS API ReportPlayer to run your custom ReportTemplate.
To start you need to pull in the ReportPlayer and a few configuration enumerators.
Next we can instantiate the instance of the ReportPlayer and place it in the app. This will show the infographics in full screen mode, showing the full pages and with the dark theme for the ReportPlayer. See the PlayerViewModes, PlayerThemes, and PlayerResizeModes documentation for additional configuration options.
In order to run the Infographic, we need to specify some additional parameters:
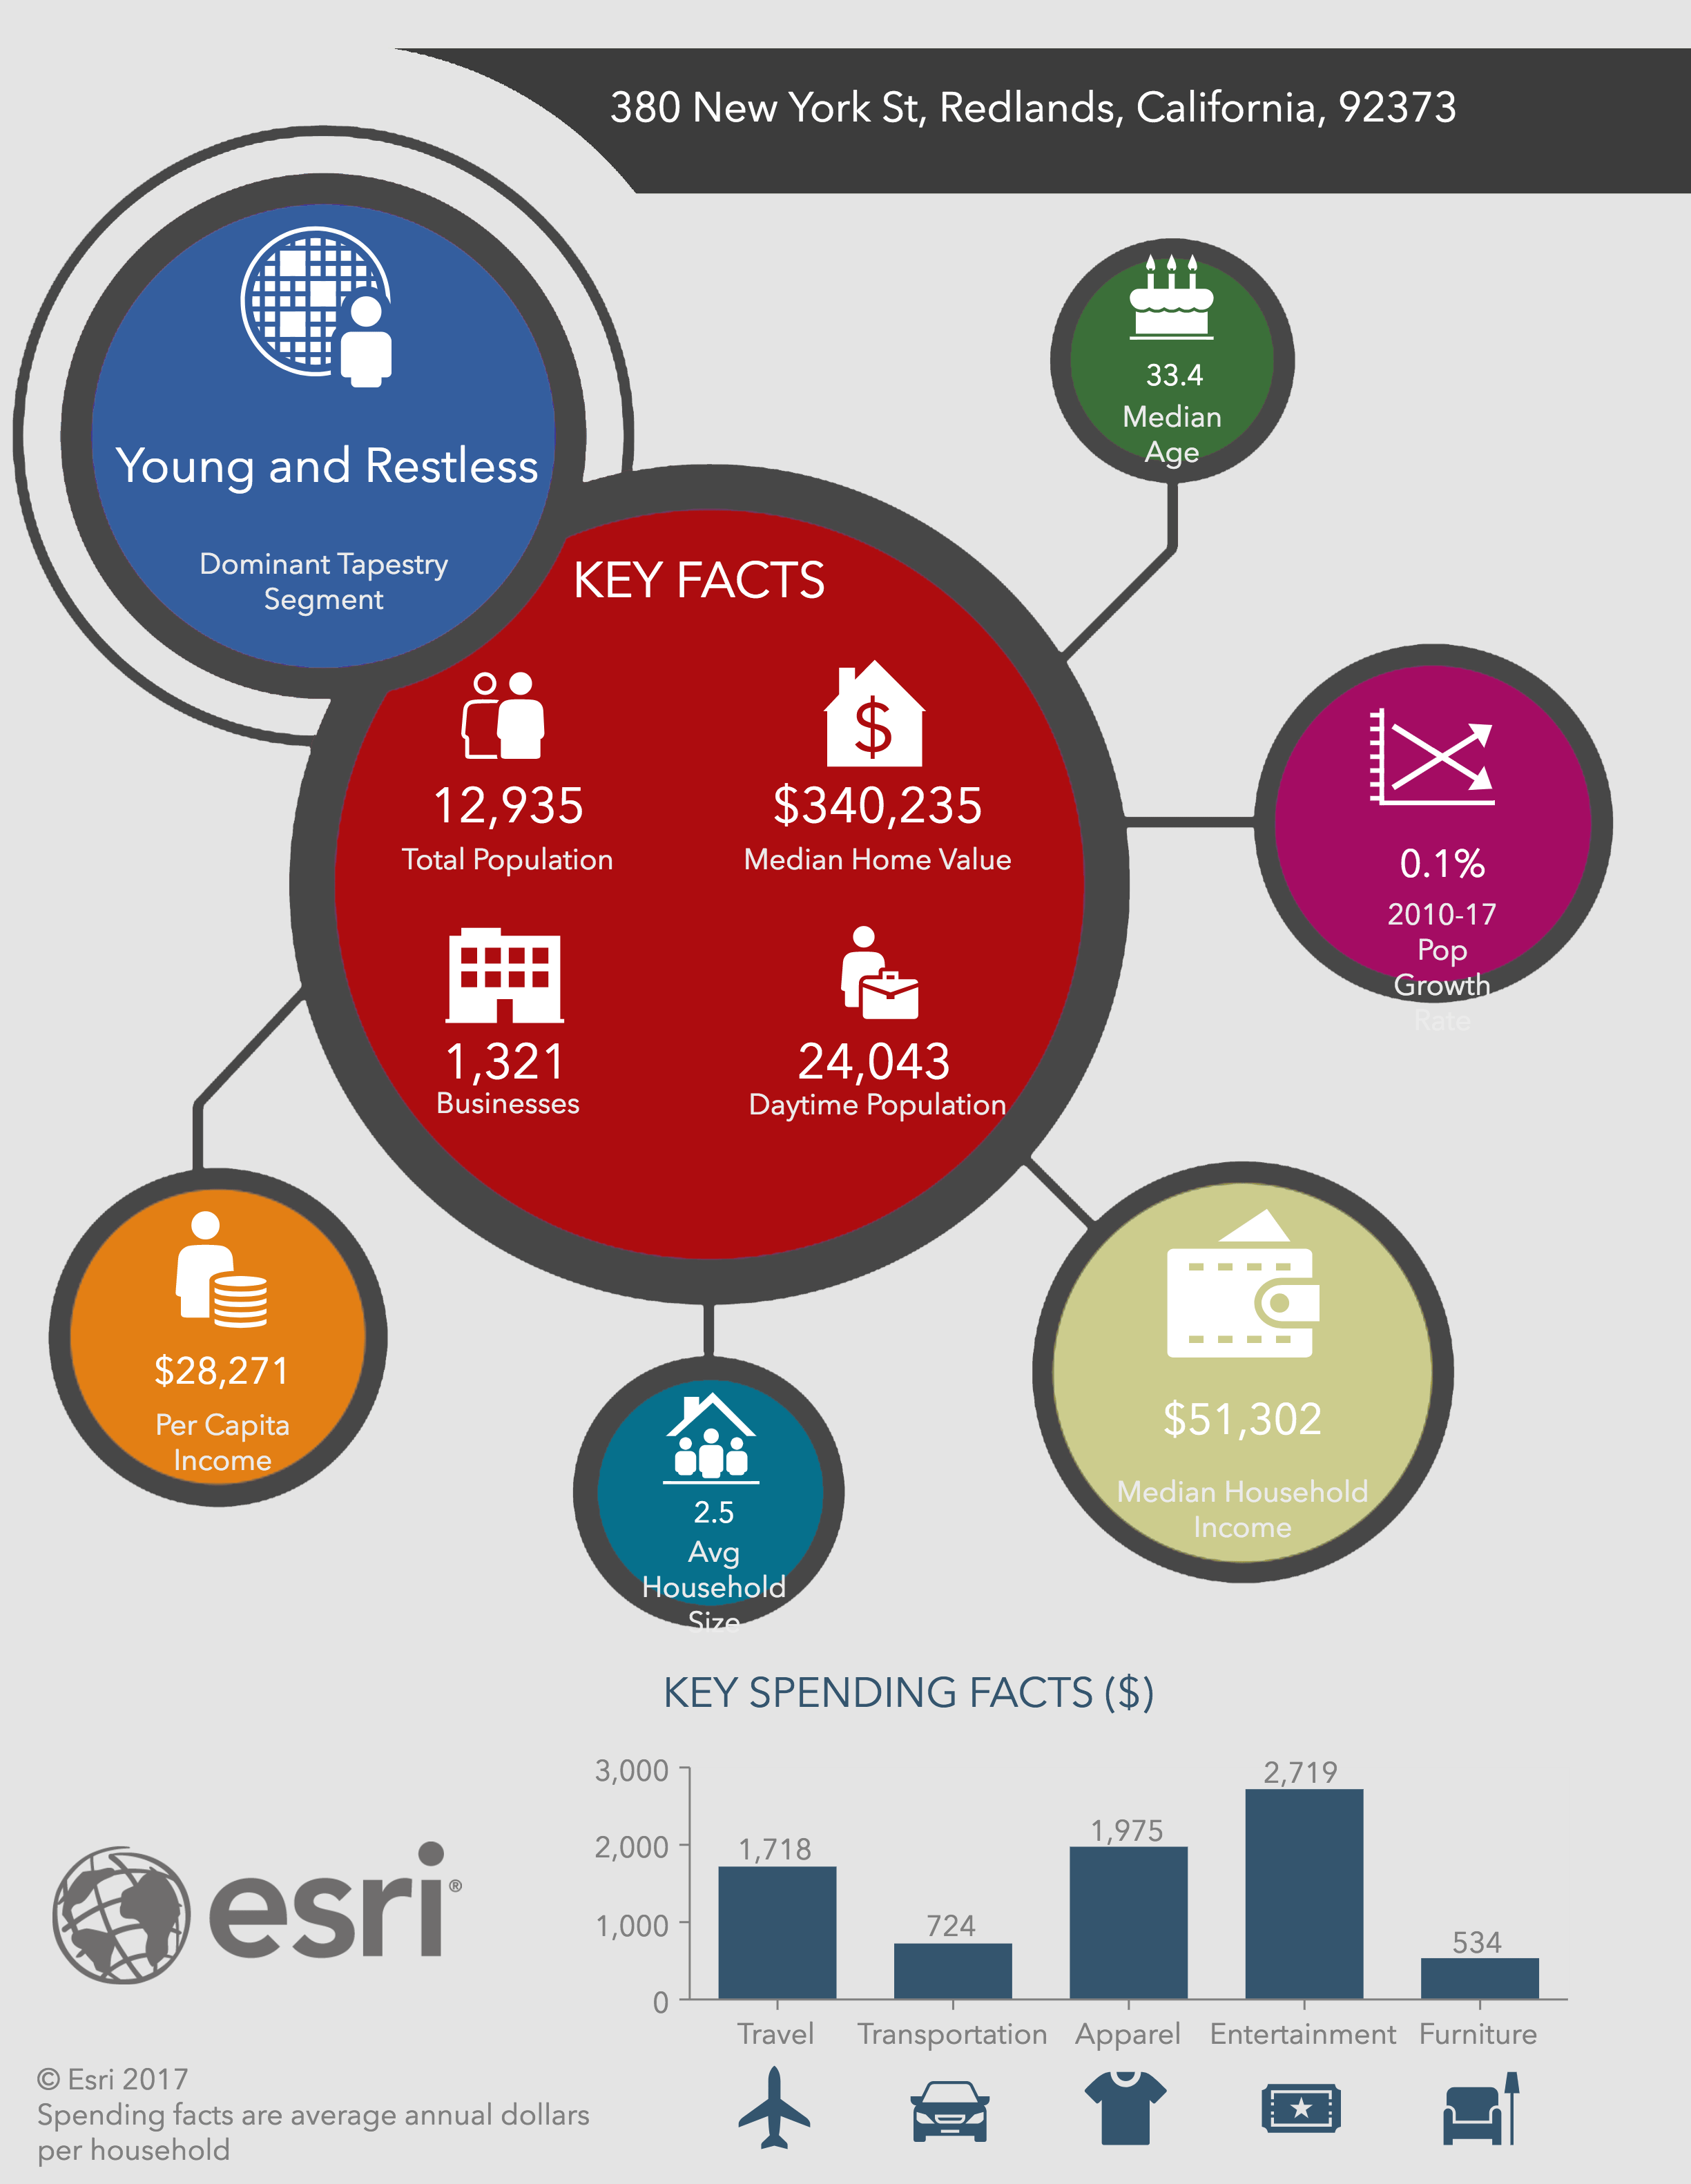
- Specify an area in which to run the infographic for. In our sample, we will create a 3 mile ring around Esri’s headquarters in Redlands. See the analysisJson object in the ReportPlayer doc for more options for specifying the area.
- Specify the portal URL. In this example we are pointing to ArcGIS Online so we are using https://www.arcgis.com. If you have Business Analyst Server, you can also point to your own on-premises portal instance.
- Specify the 2 digit country ID of the country you are running the infographic in.
- Specify the itemID of the custom ReportTemplate you created and pass it in the ‘reportID’ parameter.
After that we simply call ‘playReport’ with the specified parameters and it will generate the Infographic.
Customizing Infographics in Business Analyst Web App
If you wish to create your own infographics, you can do so with the Business Analyst Web App. You can design an infographic template from scratch or start with an existing Esri provided starter template and modify it anyway you want. To learn more about building your own infographic template, see the online documentation for the Business Analyst Web App here. A good introduction video into building your own templates can be viewed here.
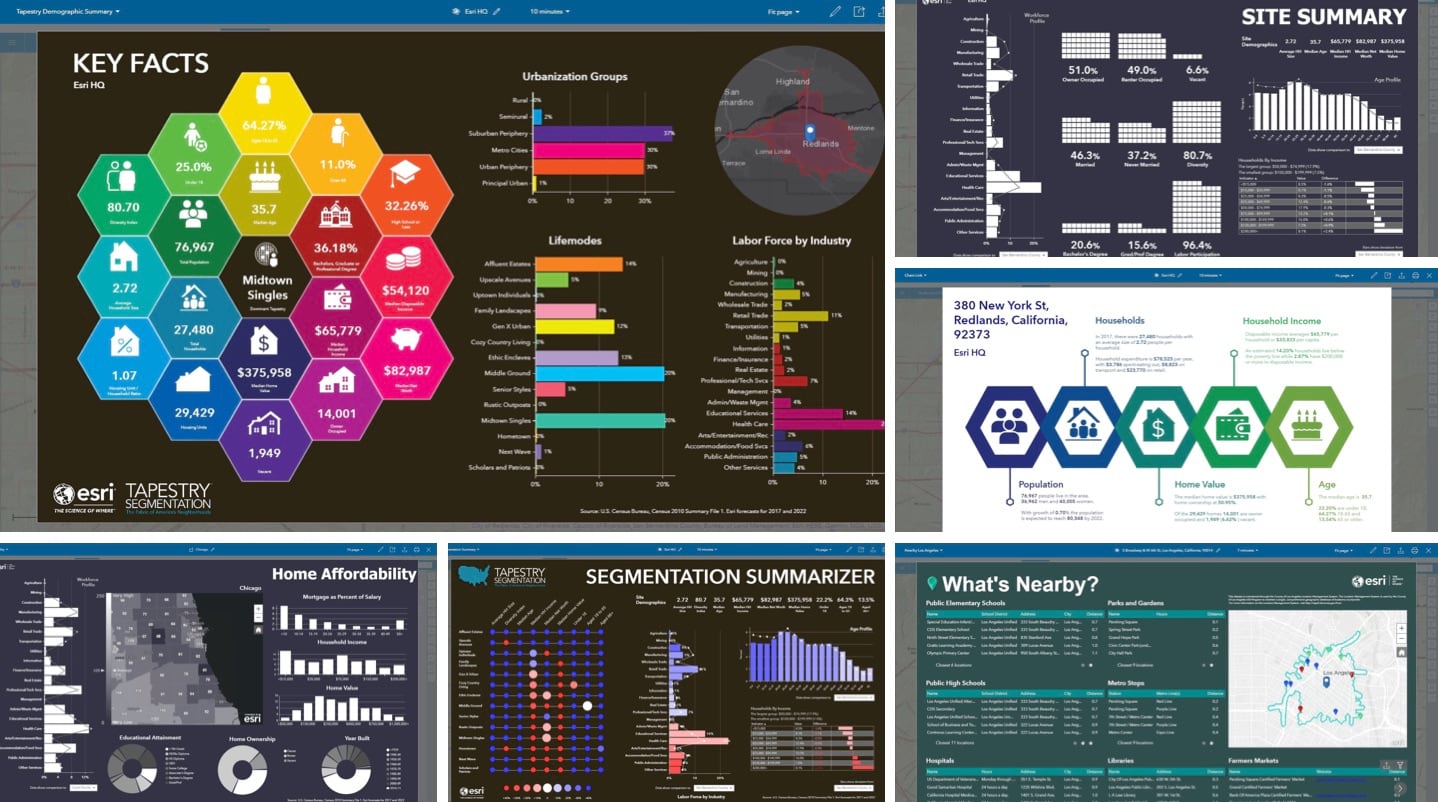
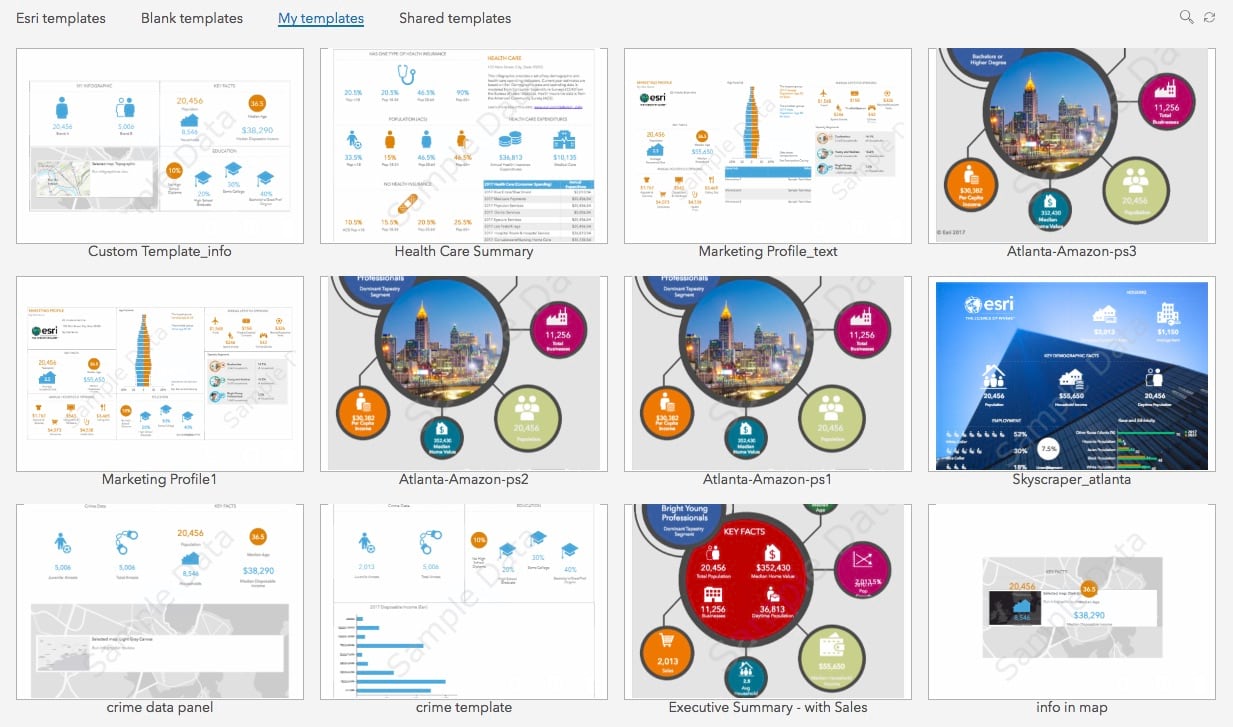
Everything is fully customizable in the infographic templates. You can change any of the variables, graphics, styles, colors, and more. If you have your own data, you can pull that in for the area and have them displayed side by side with Esri provided data. Below are examples of some beautiful customized infographic templates created using the Business Analyst Web App.
Once you create your customized infographic template, it is stored as a Report Template item in your ArcGIS Online or ArcGIS Enterprise portal.
How running infographics is different from running classic reports
Running classic reports in a custom application using the JS API uses the following approach:
- Use the CreateReport method to run Esri starter classic reports or your own custom classic report templates. All custom classic report templates, created using the Business Analyst Web Application, are stored as a Report Template item in your ArcGIS Online or ArcGIS Enterprise portal.
- Specify the area/location for which you want to run the classic report for.
- The classic report is prepared (e.g. data calculation and formatting) on the server side.
- The server-side support comes from the GeoEnrichment service.
- You can choose to configure which format you want to generate on the server side. These options include PDF and Excel formats.
ReportPlayer Widget vs Infographics Widget in the API
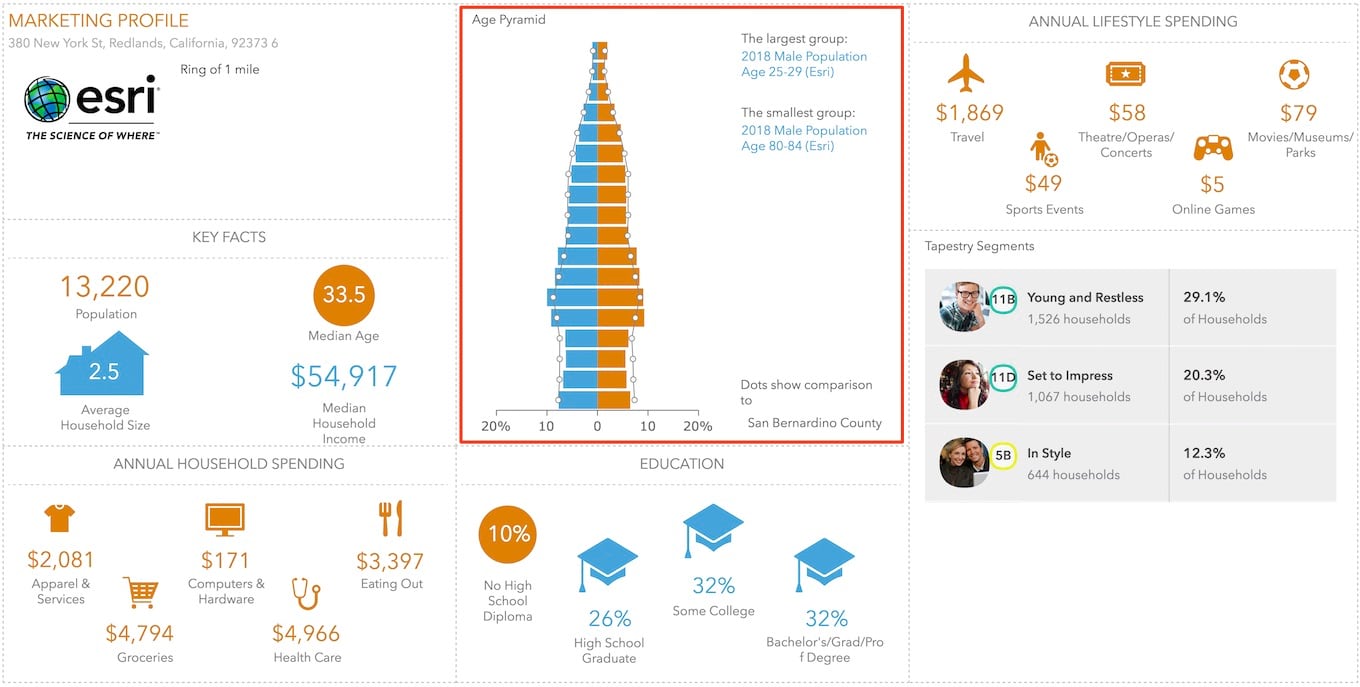
ArcGIS API for JavaScript v3.6 release in 2013 included an Infographic widget which is different from the new ReportPlayer widget. The infographics widget allowed users to run four infographic panels for the US, Age Pyramid, Income Distribution, Household by Size, and Tapestry, in their application. For outside the US, only one infographic panel, Household by Size, was available. The ReportPlayer widget allows users to run not only those four panels but much richer infographic templates that can include multiple panels, pages, interactivity and customized visualization, custom data, and your own branding. This is available for the US as well as for other countries. Those four panels and many more are available to put into the new ReportPlayer widget.
For example, the Age Pyramid panel which is available in the Infographic widget of the API is included in the Marketing Profile Esri starter template in the new ReportPlayer widget of the API.

Going forward Esri will continue to add new features, enhance, and support the new Infographics available via the ReportPlayer widget. The older JS API Infographic widget will be deprecated with the 3.x version of the JS API.
Use Beautiful Infographics in Your Applications Today
You can use the ReportPlayer widget in the ArcGIS API for JavaScript without a Business Analyst Web App license. This will allow you to use any of the 12 Esri starter infographic templates including Demographic Summary, Transportation to Work, At Risk Population, Tapestry Profile, Executive Summary, and more.

If you have a Business Analyst Web App license, you can create your own customized templates and use them in addition to the Esri starter templates. You can try or buy Business Analyst Web App here.
Learn more here and get started today.


Commenting is not enabled for this article.