The June update of ArcGIS Maps for JavaScript is here! It includes capabilities that many developers have been asking for like support for editing related records and 3D scene layers, and many bells and whistles that you can start using right away. Read on for some of the highlights in the 4.27 release.
Edit Related Records
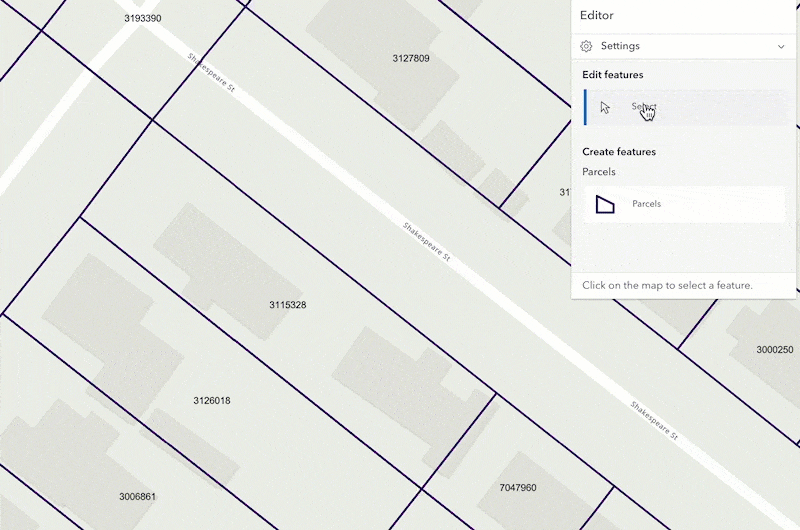
You can now edit relationship data via the Editor widget, directly from Map Viewer’s authoring experience or programmatically using the API. Our newly added relationship element enables you to configure the relationship within the form template, which will be automatically recognized by the Editor widget once the form is authored.
Additional enhancements, including feature-to-feature and table-to-table relationship editing, are planned for future releases.
Faster Initial Load
We work to optimize performance in a variety of ways with every release. In this update, we have reduced the initial load size of the API by loading the map first and loading the popup on demand.
Why did we target the popup for optimizing initial load? The Popup is very powerful and as such has many dependencies on various modules. These dependencies were so great that they accounted for nearly 50% of MapView’s initial load size. By postponing Popup’s load we are able to load the Map faster and deliver Popup capabilities if and when needed.
You might need to update your code. In most cases, no changes are required in order to take advantage of this improvement — but if you are referencing view.popup before it has been loaded, you might run into some issues. See the breaking changes section of the release notes for more information.
Edit Scene Layers
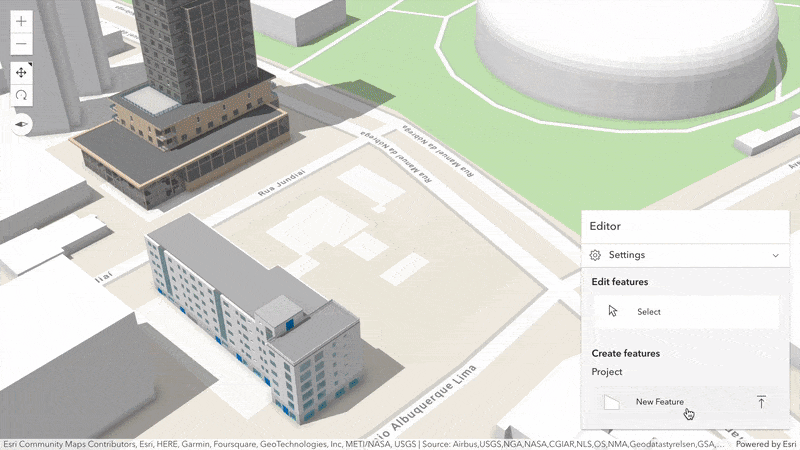
Upload and share 3D content through the web using new scene layer editing capabilities (released in beta). 3D models from various formats can be uploaded and placed using out-of-the-box Editor widget workflows. For example, buildings in a 3D object scene layer can be added, updated, or deleted directly on the web. This capability is powered by the new ability to convert model formats in the June ArcGIS Online update coming this week.
Create custom workflows using the Sketch tool and its SketchViewModel – ranging from a simple upload to transforming Mesh geometries before applying edits. Scene was already supported to update attributes in previous releases. This release adds support to update geometry by uploading 3D models.
For more information, check out the 3D Object Layer: A Comprehensive Overview blog, and the release notes.
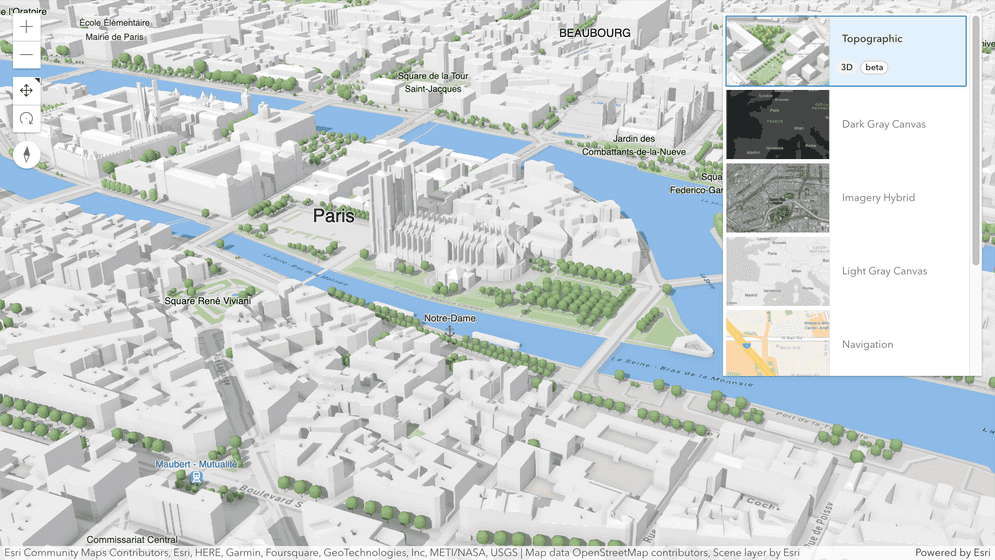
3D Basemaps
We are introducing the concept of 3D basemaps which gives you the ability to easily add curated 3D context and style to your scenes, and gives end users a 3D basemap option alongside the 2D basemaps within the BasemapGallery widget when used with 3D apps.
The new 3D Topographic basemap (releasing in beta with the June ArcGIS Online release) contains globally available buildings, trees, and labels. You can also load the 3D Topographic basemap portal item programmatically by referencing its item id.
Explore the new 3D basemap experience using the updated basemap gallery sample or directly in Scene Viewer.
Author & Save Stream Layers
With the June 2023 update of ArcGIS Online, you can style your stream layers in Map Viewer, and then save them to your web map for easy loading in your app. As with other layer types, you can apply data-driven styling, use blending and effects, create spatial or attribute filters, and utilize the various tools that you are likely already familiar with in Map Viewer to get your Stream Layer just the way you want it.
Alternatively, you can do all of this in your JavaScript code including save a Stream Layer to a web map.

Symbol Builder
The newly updated Symbol Builder application provides a modernized WYSIWYG (what-you-see-is-what-you-get) experience for configuring 2D and 3D symbols along with the corresponding code that can be copied and pasted into your app. The Symbol Builder is built with Calcite Components, React, and the JavaScript Maps SDK, and replaces the now-retired Symbol Playground.

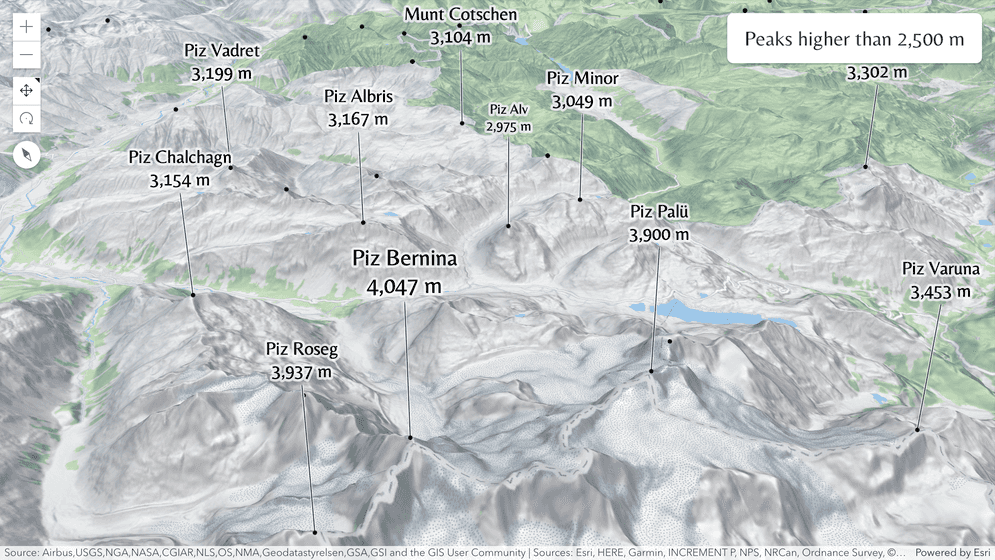
Better Labeling in 3D
Labeling in 3D has improved its font size priority rules, custom font integration, transitions, and overall visualization. Labels with larger fonts take priority over smaller ones, while existing prioritization rules based on label visibility and screen distance still apply. Scene views now support custom fonts loaded from static resources without custom CSS.
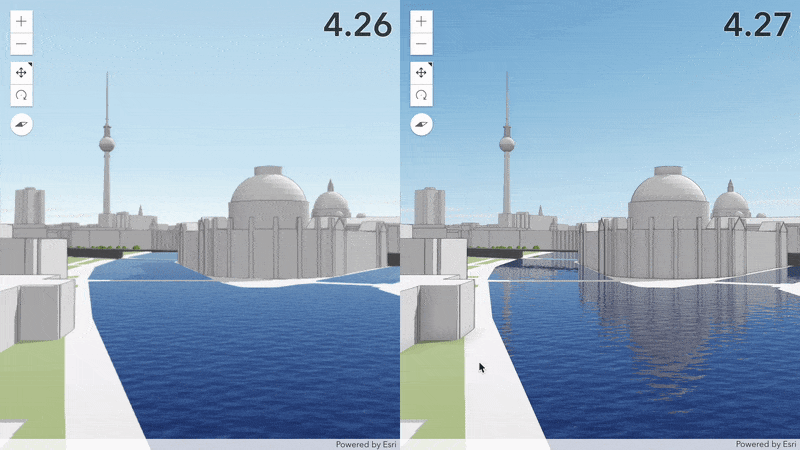
Enhanced 3D rendering
Everyone can now enjoy high quality visuals by default on all devices. We improved the default atmosphere and render scenes with shadows faster while using less memory. Rendering effects are adjusted automatically based on the current activity. When exploring a scene, we render with a similar quality as before to ensure a fluid interaction. When the camera is stationary, higher quality visuals are added to deliver the best quality possible.
Take a look how the realistic water visualization sample improved while the SceneView.qualityProfile is set to default.
Features Widget
The new Features widget (released in beta) looks and behaves similar to the Popup, however unlike Popup, the Features widget can be placed outside of the view in any part of your application. It allows users to interact with a feature’s popup template-formatted content such as attributes and media elements, as well as the UI for actions, related records, and buttons to step through multiple selected features.
What about the Feature widget? You may have already used the Feature widget which has been available with the SDK since 4.7. This widget is similar to the Features widget, except it only displays the formatted content from a single feature and doesn’t include the rest of the UI described above (actions, related records, etc).

Value Picker Widget
The ValuePicker is a slim, flexible widget that allows users to step or play through a list of values.
Like a media player, values can be interactively stepped through using next and previous buttons or configured to automatically play through an ordered list of items at a preset interval. You can optionally include the following UI components to present your data:
A combo box with a dropdown list of values:

A simple label that displays the current value:

A slider that shows a range of values:

Find Nearby Places
Use the new places class (released in beta) to find nearby points of interest within a search distance of a geographic point, and to find more information (name, category, street address, contact information, etc.) about specific places. Points of interest (POIs), are businesses and geographic locations that one can discover around the world. With the places service one can build powerful applications to help people discover, locate, and learn more about places around them. Check out the Find nearby places and details sample to learn more.

Calcite Icon in the Expand Widget
We’ve added support for Calcite icons in the Expand widget. This gives you access to over 800 icons that can be used in the Expand widget, simply by referencing the name of the icon.
![]()
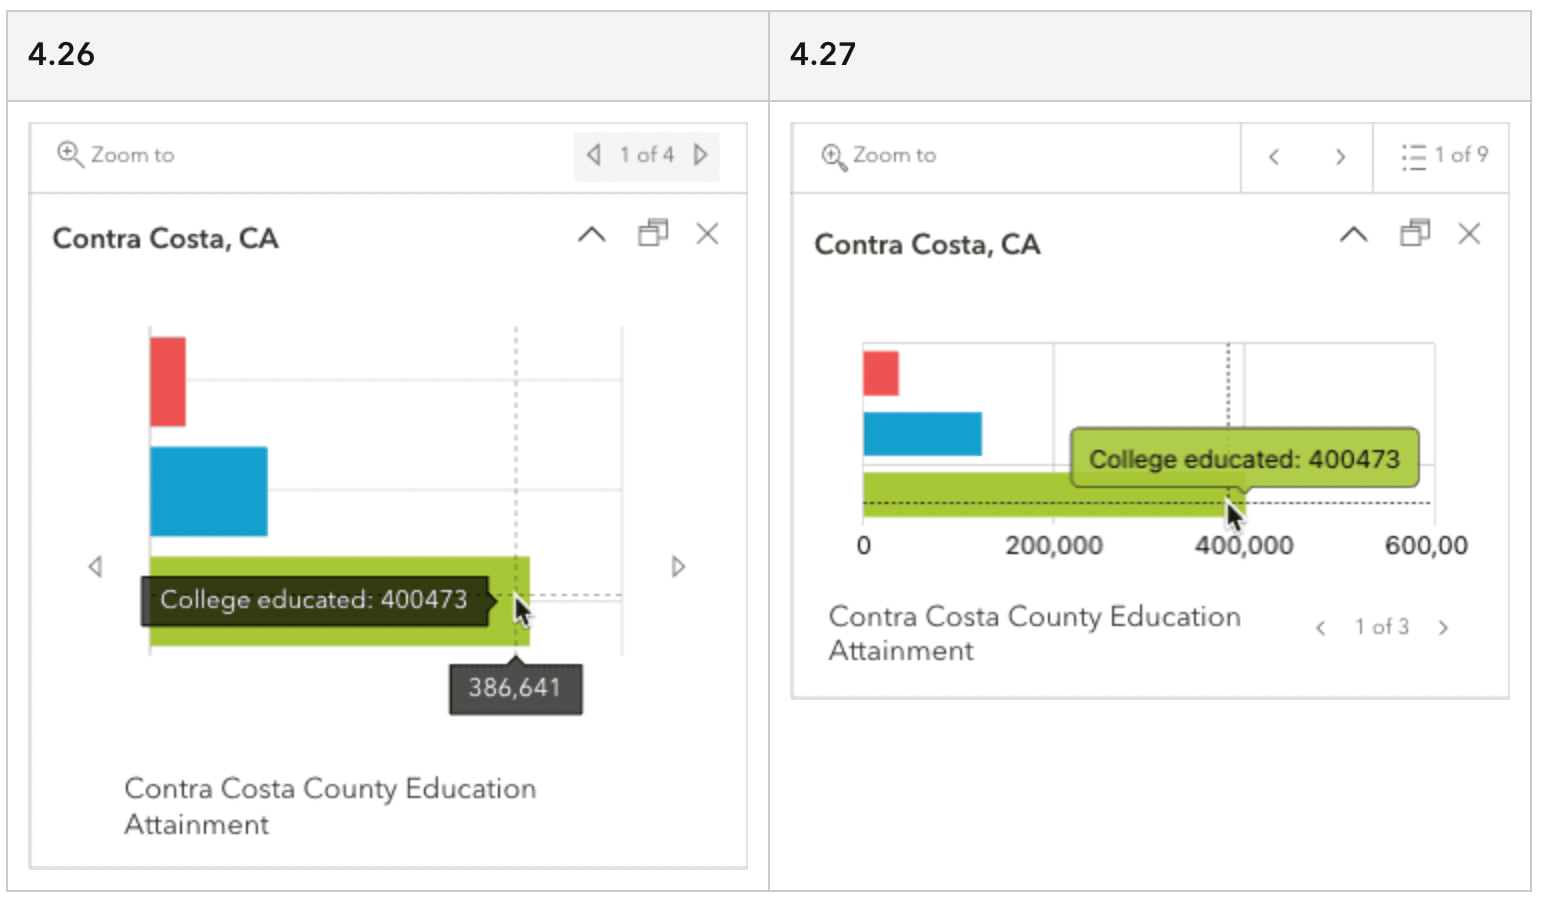
Popup Design Update
This release, we improved the Popup’s feature pagination experience with a new icon for the feature menu button, and updated buttons for paging through features. Media content pagination was updated with more horizontal space for charts and images. Popup charts now have new default colors with matching tooltip colors, an improved interaction experience, and more.
Learn More
These are only some of the highlights of version 4.27. There is quite a bit more, for example enhancements to the scale bar and track widgets, additional raster functions support for client-side image analysis, and utility network updates. Check out the release notes and explore the new samples to get to know the new release!
Join us for a YouTube Livestream, where you can hear from the engineers that worked on the release, see some demos, and get clarity on any questions you have:
Are you attending the 2023 Esri User Conference? If so, discover the opportunities for developers in the 2023 UC Developer’s Guide blog. We will be offering a range of technical presentations on key topics, there is a Developer Social event, and plenty of time to meet with the team at the Developer showcase. We hope to see you there!


Article Discussion: