Greetings web developers! We are excited to connect with you both in-person and virtually at the 2023 Esri Developer Summit! We’ve been working hard to prepare for this event packed with inspiring demos, practical technical sessions, and many opportunities to connect directly with the ArcGIS Maps SDK for JavaScript product team. This blog is an overview of the technical presentations geared towards web developers wanting to further their web mapping and development expertise.
Highlights from the last year
In the past year, we had three releases that introduced a ton of new features – from ground-breaking layer updates to quality-of-developer-life improvements. Due to the large quantity of sessions that are taking place, many topics are scheduled at the same time so we will strive to help you best plan your week. Presenters will showcase our key enhancements in performance, visualization, layer updates, editing, imagery, widgets, and general API updates. Key Highlights of the Last Year is the best place get an update on the JavaScript Maps SDK, as well as figure out which topics you want to learn more about.
Mapping and Visualization
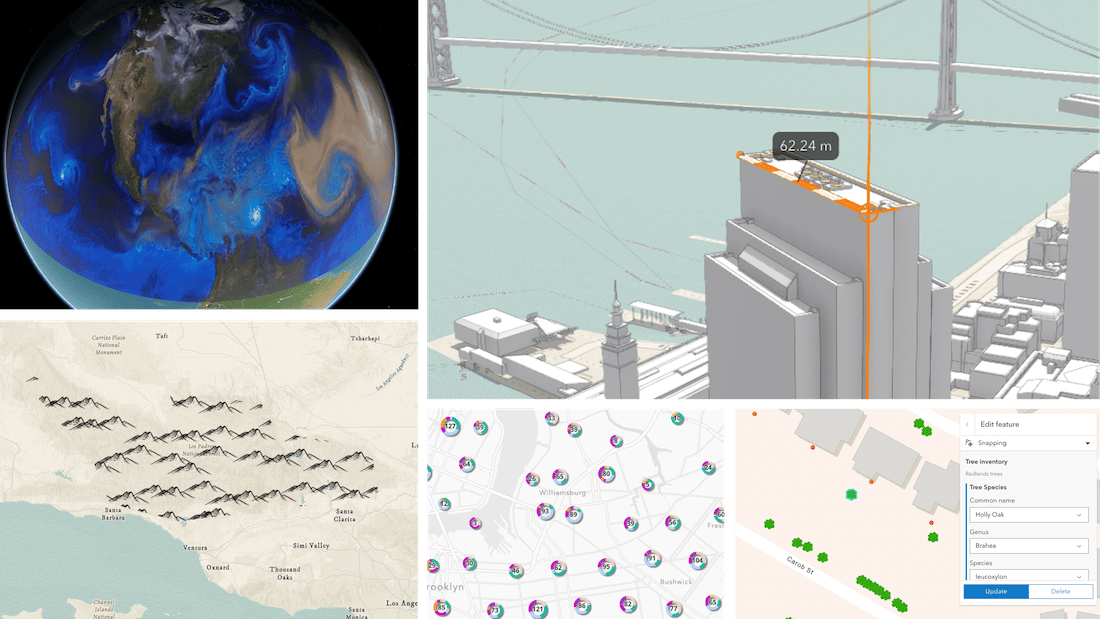
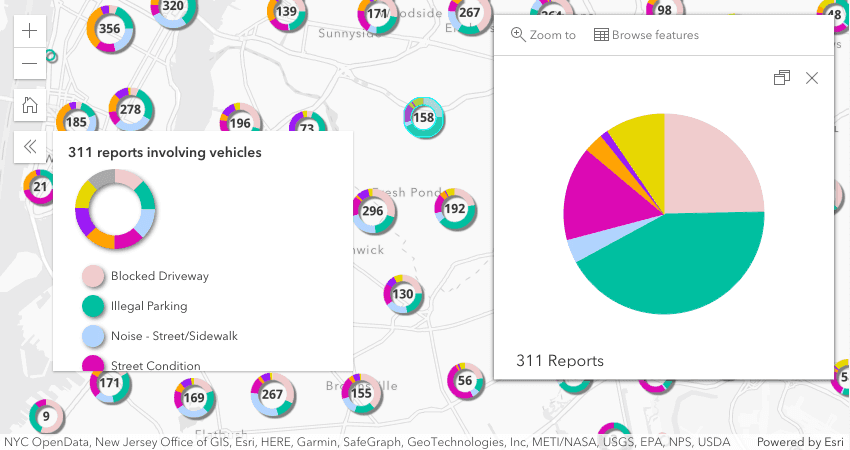
2022 was a big year in the area of mapping and visualization capabilities. We’ve been amazed by your creative, beautiful, and impactful web maps to tell your story and make our planet a better place. We expanded our JavaScript Maps SDK with new aggregation capabilities for dense datasets, pie chart styles, expanded arcade support, new multi-layer vector symbol capabilities, interactive voxel layers, and more. Our sessions cover traditional and new ways of visualizing your dataset, techniques for smooth interaction, and best practices.
- ArcGIS Maps SDK for JavaScript: Visualizing Large Datasets
- ArcGIS Online: Best Practices for Publishing and Maintaining Large Datasets
- ArcGIS Maps SDK for JavaScript: Data Visualization
- ArcGIS Maps SDK for JavaScript: Better UX with Popups
- ArcGIS Maps SDK for JavaScript: Visualizing Change Over Time
- ArcGIS Maps SDK for JavaScript: 3D Visualization
- ArcGIS Maps SDK for JavaScript: Dynamic Vector Symbology
- ArcGIS Maps SDK for JavaScript: Using Arcade with Your Apps
Session highlight: ArcGIS Maps SDK for JavaScript: Visualizing Large Datasets
Visualizing large and dense dataset in a clear way has always been challenging. Overlapping features in large datasets often hide their true spatial patterns, making it difficult for intuitive data visualization. We added a lot of enhancements in the JavaScript Maps SDK last year to address this issue. In this session, we will demonstrate several effective methods to visualize large datasets, front client-side techniques for visualizing density and clusters to server-side preprocessing and aggregation. We also offer ArcGIS Online: Best Practices for Publishing and Maintaining Large Datasets for the best practices of managing large datasets in ArcGIS Online.
Working with your data
In this information era, everything is about data. With the JavaScript Maps SDK, we have a series of enhancements that help you fully release the power of your dataset and those available online, so you can create the best data-driven experience for your audiences. We are offering the following sessions that cover the capabilities of the feature layer, how to maximize performance, how to bring data from anywhere, and best practices to work with hosted layers and public data.
- ArcGIS Maps SDK for JavaScript: Using the Feature Layer
- ArcGIS Maps SDK for JavaScript: Maximize Performance and Capabilities of the Feature Layer
- ArcGIS Maps SDK for JavaScript: Bring in Data from Anywhere
- Working with Hosted Feature Layer Views and Public Data
Session highlight: ArcGIS Maps SDK for JavaScript: Maximize Performance and Capabilities of the Feature Layer
Feature layer is our best layer to work with feature data directly on the web. In this session, we will discuss and demonstrate different options and techniques to optimize the performance of the layer, from the service configuration and caching to the client-side queries to take advantage of data already in the web browser.
Analysis
The JavaScript Maps SDK offers a suite of analytical capabilities that allow you to do advanced and dynamic analysis; including instantaneous client-side analysis that is performed entirely in the browser. The following sessions cover techniques for building interactive, analytical workflows with feature data and imagery.
- ArcGIS Maps SDK for JavaScript: Client-Side Queries & Analysis
- ArcGIS Maps SDK for JavaScript: Working with Imagery
- ArcGIS Maps SDK for JavaScript: Working with RouteLayer
Building 3D experiences
As one of the core capabilities in JavaScript Maps SDK, 3D is not just displaying buildings, it is another dimension to explore our planet. 3D updates are huge in 2022. We added visualization enhancements such as weather effects and terrain shading, more editing capabilities including full 3D snapping, voxel layer improvement to visualize impressive volumetric data, and a lot more. Our 3D sessions at DevSummit focuses on the 3D workflows for web apps and 3D visualization.
- ArcGIS Maps SDK for JavaScript: 3D Workflows for the Web
- ArcGIS Maps SDK for JavaScript: 3D Visualization
Session highlight: ArcGIS Maps SDK for JavaScript: 3D Workflows for the Web
In this session, you will learn how to leverage various interactive capabilities of the ArcGIS Maps SDK for JavaScript to build powerful and performant 3D web apps. We’ll look at readily available widgets and components used for editing, analysis and querying. You will see how many of the concepts known from working with 2D maps and feature layers also apply to scenes and 3D-specific layers.
Create better experiences, easier
Calcite Design System. Calcite Design System 1.0 has officially arrived earlier this year! As a collection of design and development resources, Calcite is your resource to design and build beautiful, user-friendly, cohesive, and accessible experiences to your users. In the following sessions, we are going to explore fundamentals of the Calcite Design System, how to utilize it to build beautiful apps with JavaScript Maps SDK and web development frameworks, how to leverage Calcite to build accessible web apps, and of course what you can expect from Calcite in the future.

- Calcite Design System: What’s New and Road Ahead
- Designing Apps with Calcite Design System
- Building Web Apps with ArcGIS Maps SDK for JavaScript and Calcite Design System
- Building Web Apps with Calcite Design System and React
- Building Accessible Web Apps with ArcGIS Maps SDK for JavaScript and Calcite Design System
Editing. We introduced a lot of new editing capabilities in the past year. You can now create user-friendly editing experiences both in 2D and 3D that maximize your user’s productivity and ensures data accuracy. Come to our web editing session to learn more about how to leverage our new editing capabilities to build the next-generation web editing experience.
Building UI components. Widgets and UI components are essential tools to create custom experiences easily. Widgets in JavaScript Maps SDK allows developers to use the “viewModel” to create a custom experience with minimal efforts. In the sessions below, you will learn how you can create your own view with a custom look at feel using widgets and how to build web apps using web components.
- ArcGIS Maps SDK for JavaScript: Build a Custom UI for API Widgets
- Building Apps with Geospatial Web Components
Best practices, development techniques, and tooling
The JavaScript Maps SDK leverages modern web development technologies so you can build the best interactive geospatial experience. We are offering the following sessions focusing on best practices for building web apps, techniques for developing, and useful tools for productive development.

- ArcGIS Maps SDK for JavaScript: Best Practices for Building Apps
- TypeScript: What Is It and Why Might I Need It?
- ArcGIS Maps SDK for JavaScript: Tips and Tricks for Developing and Debugging Apps
- Enterprise JavaScript: Build and Testing for Production
- A Practical Guide to ArcGIS Online Security
- ArcGIS Online: Best Practices with Hosted Feature Services
Session highlight: ArcGIS Maps SDK for JavaScript: Best Practices for Building Apps
This session focuses on how to use the latest release of the ArcGIS Maps SDK for JavaScript to build your own custom applications. We’ll cover patterns and tooling for building applications that can be used across various frameworks.
Getting to know the API
If you are new to web development or to the ArcGIS Maps SDK for JavaScript, our introduction and fundamental sessions are perfect for you. We’ll guide you through your first web mapping application in Demo Theater and cover the programming basics of the SDK in our Technical Session.
- An Introduction to JavaScript for Future Web Developers
- ArcGIS Maps SDK for JavaScript: Programming Patterns and API Fundamentals
Dive deep and look far
Under the hood. Curious about the underlying technology that powers the ArcGIS Maps SDK for JavaScript? Come to this session to explore some of the architecture, tools, techniques, and modern browser capabilities that we leverage to enable optimum performance and capabilities. You can then apply these techniques to your own web app development.
Road Ahead. Product Managers and development leads for the JavaScript Maps SDK will discuss our road map and our 2023 and beyond development strategy with you.
Asking Anything
This is a session for YOU. You can ask any question about the ArcGIS Maps SDK for JavaScript, and our panel of Esri developers from the ArcGIS Maps SDK for JavaScript team will answer for you. There’s no bounds, just informative time between you and the JavaScript Maps SDK team!
There’s a lot going on!
In addition to the technical sessions, there are several great activities planned for getting to know esri product teams, networking with other developers, and to have fun!
- Watch the Plenary sessions that showcase the technology updates that we are most excited about
- See this guide on things to do at the conference.
- Find the JavaScript Maps SDK & Calcite Design System development teams at the Web Development showcase
- See keynote speakers that will spotlight some amazing customer journeys and implementations.
Discover some cool places and things to do in Palm Springs using this tour.


Article Discussion: