Right after graduation I worked as a GIS/cartography intern with the Swiss National Park. That involved living in the mountains and making maps all day long. For a cartographer, that’s a dream life. I once received the task to create an interactive 3D hiking map of the park. Back then, 3D mapping APIs weren’t very friendly to cartographers. The documentation was poor, features were limited, and it didn’t look the best. So I put that project aside.
Fast forward to now (4 years later): even though I am not working for the park anymore, I decided to give the 3D hiking map another shot. I used ArcGIS API for JavaScript for the 3D web visualization and ArcGIS Pro for processing and publishing of the hiking trails. I am not going to take you through the whole process of building this app, but I’ll present the highlights and tell you about the fun/interesting bits.
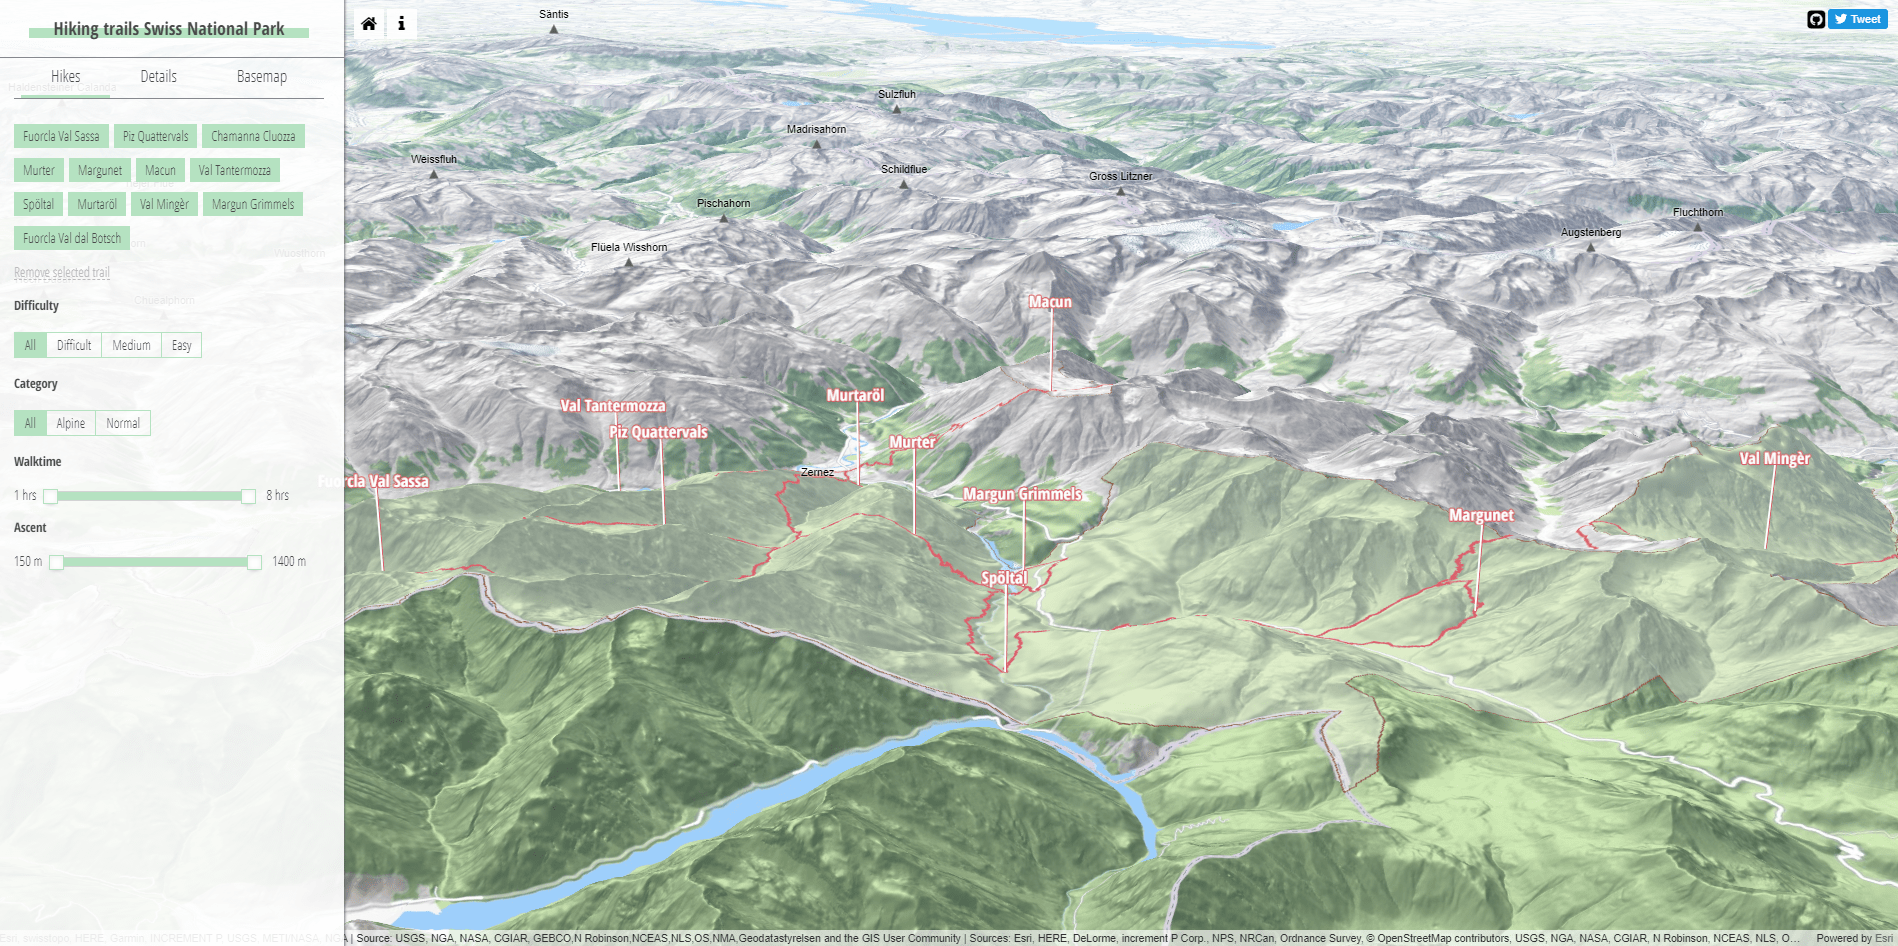
Explore the final app here or in the frame below. You can filter the trails by difficulty or walk time. Select a trail from the list or in the map to display more details such as the trail name, a description, and an elevation profile.
Fun facts about creating a 3D hiking map
Fun fact 1: It all started with a sketch
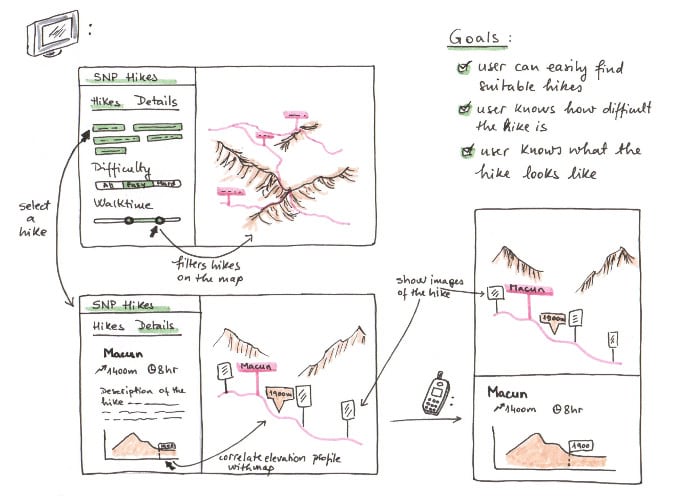
Well, with several sketches actually. Sketching really helps in the beginning to experiment with many ideas. In my case, it also helped to define the goals of the application. Besides saving implementation time, prototyping with pen and paper helps me be more creative and less distracted by miscellaneous things.
This is the sketch I used for the final implementation:
Fun fact 2: I built this app with 2D data
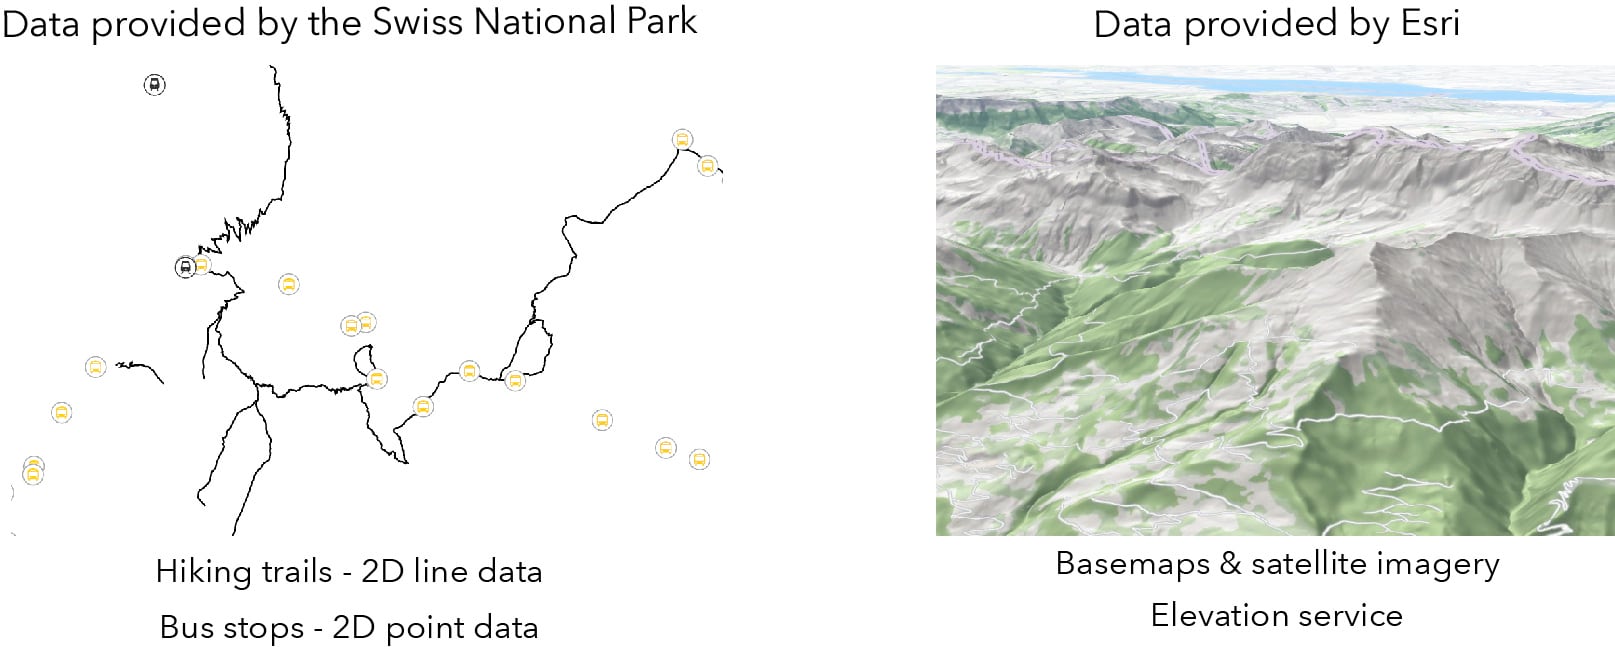
The web is awesome because it allows you to combine different resources and access data using various APIs. When I decided to build this app, I had the hiking trails from the Swiss National Park and points for the bus stations, but I didn’t have any elevation data. So I used Esri’s world default elevation service available in ArcGIS Online. You can read more about the different elevation services in this blog post. Unless you need highly detailed elevation data, this service is accurate and in many areas even reaches a precision of 0.5m. With a service like this, you don’t need to have 3D data. You can just plug in your 2D data and use different elevation modes to align the data to the ground. See the Elevation options sample for an explanation on how different elevation modes work.
Fun fact 3: The elevation profile is built client-side based on the 2D hiking trails and the world elevation service
The elevation profile is created every time a user clicks on a trail. For the selected trail, the elevation profile data is generated based on the hiking trail geometry and the elevation service.
The secret ingredient to this is the queryElevation method: it enriches 2D geometries with z-values, based on an elevation service. I call this method on an elevation layer: Elevationlayer.queryElevation(geometry). I also set the demResolution to "finest-contiguous" to make sure that it returns the most accurate value. queryElevation can also be called on the ground surface using Ground.queryElevation(geometry). In this case it will query all the elevation layers in the ground from top to bottom and it will return a value from the first layer that has a valid value.
// find elevation layer that should be used for querying
const elevationLayer = view.map.ground.layers.getItemAt(0);
// pass the 2D geometry (multipoint, point, line)
elevationLayer.queryElevation(feat.geometry, {
  // specify the resolution level
  demResolution: "finest-contiguous"
}).then((response) => {
  // returns geometry with z values
  console.log(response.geometry);
});
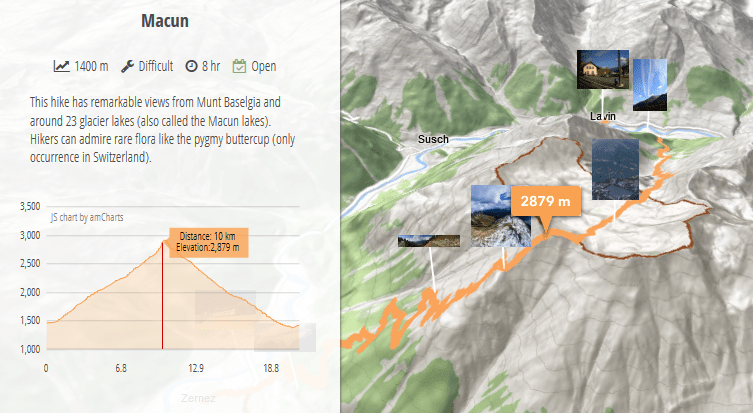
One problem that I encountered is that if a trail has several paths, there is no easy way to display all of them in the elevation profile. So I chose to create the elevation profile only for the longest path in the trail. I check for the path length using geometryEngine.geodesicLength().
And that’s about it. Here’s what the elevation profile looks like (notice the nice popup that shows on the map where the elevation profile cursor is):
Fun fact 4: This app is mobile-friendly
A hiking app is useful when you’re hiking. So it should work on mobile devices. How to do this?
At the beginning I adapted the user interface for a mobile device (as shown in the sketch above). Go ahead and try to resize the browser or open the app on your phone. You’ll see that it adapts its layout to the size of the device.
But there’s more that you can do to make your web app mobile-friendly. Maybe you’ve already heard the term Progressive Web App, also called a PWA. It is a set of guidelines and technologies that brings the native app behavior to a web application. Short disclaimer here: my app is not a full PWA, but I borrowed some of the principles to make this app mobile-friendly.
First of all, you can install this app on the home screen of your phone, just like you would with native mobile apps. To do that you need a manifest file with metadata about the application (name, icons to be used on the home screen etc.).
Secondly, the app uses a service worker to cache data that has been requested before. So if you visit a certain hiking trail, that data won’t be requested again, the second time you click on the trail. This caching is done by a a service worker.
If you want to find out more about PWA, you can read all the details on the Google PWA website.
Fun fact 5: Building this 3D hiking map is similar to building a 2D one
There is a myth that creating 3D apps is complicated and you have to understand heavy math and computer graphics to build even the smallest app. Of course it depends on the application, but building this hiking app with the ArcGIS API for JavaScript took the same amount of effort as it would take to build it in 2D. Here are some proofs to this bold statement:
- in a very basic app switching from 2D to 3D boils down to replacing the MapView class with the SceneView class. You can try it out in this sample, just replace
SceneViewwithMapViewand it will display a 2D map. - a scene has a basemap and several layers, just like a map. A difference is that a scene can also have a ground, with several ground layers (which are used for displaying the terrain and which we used for querying the elevation).
As a matter of fact, I encourage you to have a look at the app code on Github. Fork it and build your own hiking app with it. I created this configuration file to define the data sources. Replace it with your own data and let me know what you made!
Have fun mapping! (and hiking)
Raluca

Commenting is not enabled for this article.