I’m excited to introduce dot density as the latest visualization tool available in the ArcGIS API for JavaScript (ArcGIS JS API). Dot density is a classic cartographic technique that involves randomly drawing dots within polygon boundaries to visualize the density of a population or some other count.
The the following app demonstrates this concept. In the image below, each dot represents approximately 4,800 people.

This app uses the DotDensityRenderer, new in the 4.11 version of the ArcGIS JS API, to render population by Census Tract.
The API for creating this visualization is pretty straightforward. It only requires the following code.
const dotDensityRenderer = new DotDensityRenderer({
  referenceDotValue: 4800,
  outline: null,  // avoid the default outline
  legendOptions: {
    // legend displays 1 dot = 4800 people
    unit: "people"
  },
  attributes: [{
    field: "B03002_001E", // field name for population
    color: "#e8ca0d",
    label: "Areas where people live"  // label in legend
  }]
});

// apply renderer to the layer
layer.renderer = dotDensityRenderer;
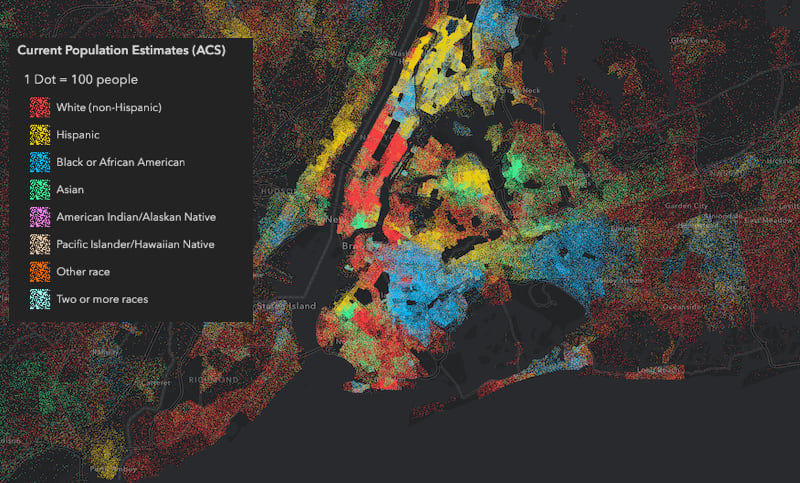
The attributes property allows you to map several subcategories of the population. To visualize the population density broken down by race/ethnicity, for example, you would simply include objects that match field names containing the total population per race to specific colors.
dotDensityRenderer.attributes = [{
  field: "B03002_003E",
  color: "#f23c3f",
  label: "White (non-Hispanic)"
}, {
  field: "B03002_012E",
  color: "#e8ca0d",
  label: "Hispanic"
}, {
  field: "B03002_004E",
  color: "#00b6f1",
  label: "Black or African American"
}, {
  field: "B03002_006E",
  color: "#32ef94",
  label: "Asian"
}, {
  field: "B03002_005E",
  color: "#ff7fe9",
  label: "American Indian/Alaskan Native"
}, {
  field: "B03002_007E",
  color: "#e2c4a5",
  label: "Pacific Islander/Hawaiian Native"
}, {
  field: "B03002_008E",
  color: "#ff6a00",
  label: "Other race"
}, {
  field: "B03002_009E",
  color: "#96f7ef",
  label: "Two or more races"
}];
This creates a fascinating visual of not only population density, but also of how diverse (or similar) and segregated (or integrated) the population is based on race/ethnicity in some cities.
Dot density was originally designed for print maps, so in practice it only works well at one scale level. A value of 6,400 people per dot may work well for large regions, such as the entire lower 48 United States…

…but won’t work well for smaller regions, such as New York City.

At this scale dots are difficult to see, significantly deemphasizing the population density of the area. It almost looks as if New York City is a rural area.
Conversely, a dot value that works well for small regions, won’t work for larger regions. For example, if I alter the dot value to better visualize the population density of New York City (1 dot = 200 people)…

And use that same value for the extent of the United States, then half the country looks like it is part of an overgrown metropolis. At large extents, small dot values can exaggerate the perception of density in less populated areas.

These scale issues prompted us to include the referenceScale property in the renderer. This allows you to match a dot value to a scale value. As the user zooms in and out, the value of each dot will change based on the change in scale.
For example, setting the referenceScale to 577790 will yield a much better visualization across scales.
const dotDensityRenderer = new DotDensityRenderer({
  referenceDotValue: 200,  // 1 dot equals 200 people
  referenceScale: 577790, // at a 1:577,790 view scale
  legendOptions: {
    unit: "people"
  },
  attributes: [
    // field names and colors here
  ]
});
In other words, at a 1:577,790 scale, each dot will represent 200 people. Once the referenceScale property is set to any number, the dot value will update linearly based on the scale change from the indicated referenceScale. This makes a far more pleasing visualization at various scale levels.


If that scale value looks arbitrary, that’s because it mostly is. When authoring a dot density visualization I usually pick a scale where I want the app to start. I set that to referenceScale, then modify the referenceDotValue until I settle on a value I like. That setting will usually work pretty well across scales.
More data, more interaction
This implementation of dot density renders on the GPU. This allows us to visualize more data with more dynamic interaction than ever before.
Check out the following app to explore this data further. Use the Bookmarks widget to view areas I thought were particularly interesting. You can also use the Search widget to explore the demographics for your hometown (if you live or have lived in the United States). I also configured a popup so you can click regions of interest to view the estimated population of each Census Tract.
Population density by race/ethnicity in the United States
Keep in mind…
I advise you to set minimum and maximum visibility scale restrictions on layers rendered with dot density. The minScale will prevent the view from rendering features too small for sensible interpretation.
Setting the maxScale at a proper level will help keep the user from making incorrect inferences from the data. For example, when zoomed too far in, users may start to see spatial patterns in the dots that don’t actually exist (since they are randomly drawn). In visuals where one dot equals one unit (e.g. one dot equals one person or one house), users may also be susceptible to incorrectly reading the dot locations as actual locations of the mapped phenomena. So setting reasonable view constraints and/or layer visibility constraints will help prevent this.
const view = new MapView({
  container: "viewDiv",
  map: map,
  constraints: {
    // user can't zoom beyond this scale
    maxScale: 35000
  }
});
Also keep in mind that since dot density is heavily influenced by a feature’s area, you should try to use equal area spatial references since heavily distorted areas will paint an incorrect picture of the density of features compared to less distorted areas.
You can get away with using distorted spatial references, such as Web Mercator, as long as you only compare areas that lie on about the same line of latitude. Therefore in my app, you shouldn’t compare the population density of tracts in Alaska with those in Florida.
Because we take advantage of the GPU in rendering dot density, you can add more interaction to your dot density visualizations. Stay tuned for more posts demonstrating how to do the following:
- Explore dot density with an interactive legend
- Create an animated dot density visualization
- Visualizing change with dot density
- Create bivariate visualizations with dot density

Commenting is not enabled for this article.