Heat maps in the ArcGIS API for JavaScript (JS API) are now faster, smoother, and can render more data in the browser than ever before.
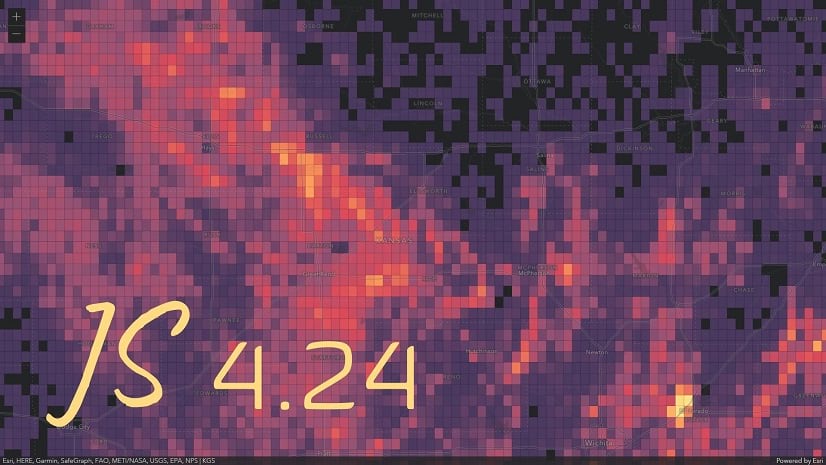
A heat map is a visualization style that renders point data as a continuous raster surface. The surface typically visualizes “hot” areas with bright colors in areas where point data is more dense. Heat maps are particularly useful for visualizing a large number of points, where many points may overlap. For example, the heat map below shows the density of oil and gas wells in Kansas.

Conversely, if I represented each well as a point, it would be nearly impossible to know which areas have more wells than others.

Version 4.24 (June 2022) of the JS API upgraded HeatmapRenderer to render with WebGL. This update introduces the following improvements:
- More data can be rendered with the HeatmapRenderer than before.
- Significant performance updates, which make the experience of navigating layers with HeatmapRenderer more smooth.
- Data rendered with the HeatmapRenderer can now be filtered client-side, with FeatureFilter and FeatureEffect.
- Added popup and hitTest support.
- Added labeling support.
Prior to this release, the JS API’s rendering engine used Canvas to render heat maps. This latest update makes it the last renderer in the JS API to migrate to WebGL.
Examples
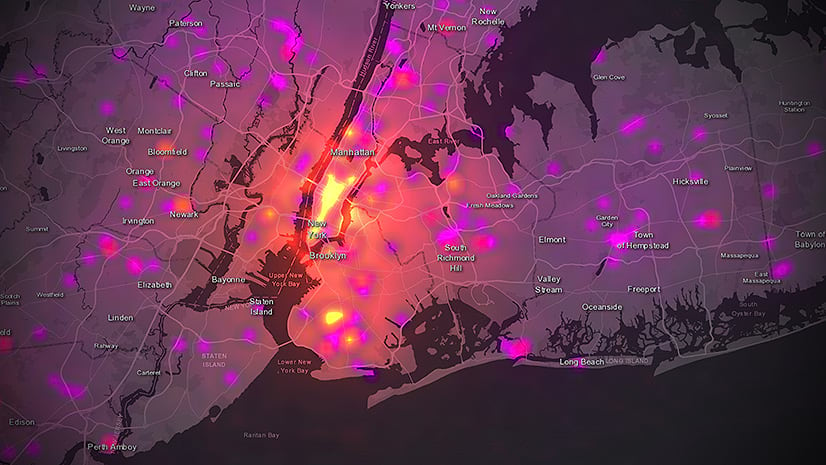
The following app shows a heatmap of earthquakes where only earthquakes magnitude 5.0 or larger are labeled. I also added a popup so you can click any point in the map to view information about each earthquake in that area.
Labels

Popups

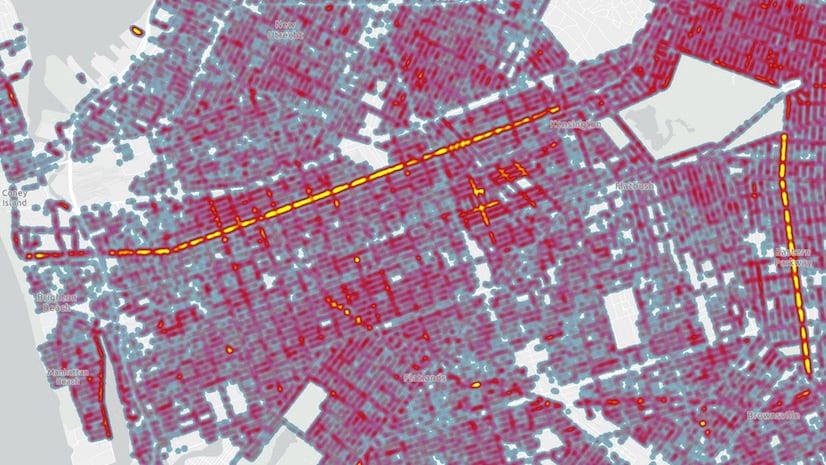
Prior to 4.24, you could not filter data rendered with HeatmapRenderer client-side. By association, that meant Heatmaps did not filter or update on time-enabled layers hooked up to a TimeSlider. Now, you can filter heat maps as you would if the layer had any other renderer assigned to it.
Filters and effects

. Notice how crash density decreased dramatically after March 2020.")
Heat maps now use kernel density
The underlying strategy for calculating density in HeatmapRenderer changed from Gaussian blur to kernel density at version 4.24.
This was motivated by an effort to make JS API heat maps render more consistently in future versions of ArcGIS Pro. The JS API introduced the following new properties specific to the kernel density formula:
- radius replaced
blurRadius. - minDensity replaced
minPixelIntensity. - maxDensity replaced
maxPixelIntensity.
This is a soft update, so you don’t have to worry about HeatmapRenderer breaking when you upgrade API versions.
For example, if you update an app to version 4.24 that originally authored a HeatmapRenderer in any prior API version, the heat map will render consistently as it did in the prior versions. No code updates required! The JS API’s rendering engine internally reads the old Gaussian blur values, and converts them to their equivalent kernel density values. The heat map essentially renders as it did before even if you had no knowledge of the new API properties.
Click the image below to view a larger version of it.
. Heat map of the same variable rendered using kernel density (right). Internally, the JS API will attempt to keep the look and feel of heat maps consistent when upgrading to 4.24, even though it uses a different algorithm (kernel density) than prior versions (Gaussian blur).")
However, when you update to version 4.24 you will begin to see a console message, warning you to use the new kernel density properties. This message reports the values the new properties should use if you want to maintain a consistent visualization with the old property values.

Heat maps authored in Map Viewer Classic (3.x JS API) will also consistently render in newer web apps.
Conclusion
These updates allow us to bring feature parity to layers rendered with HeatmapRenderer, while fixing several bugs reported over the last few years. Check out this post by my colleague Mark Harrower, which discusses related heat map updates to the Smart Mapping UI in the Map Viewer.

Article Discussion: