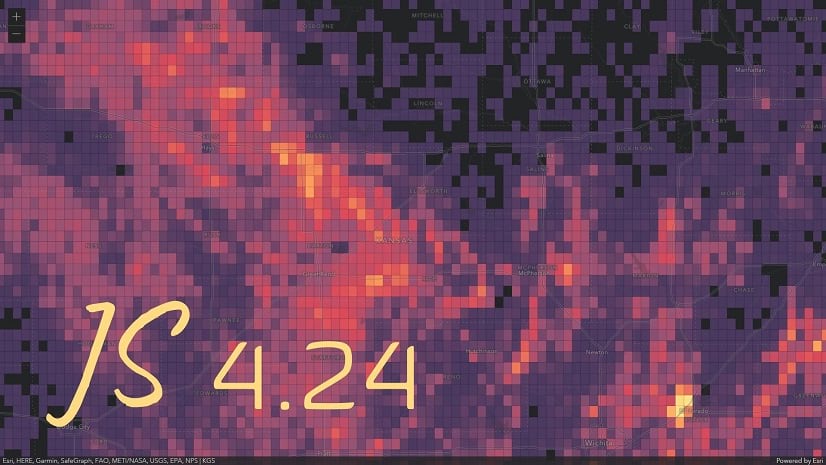
Version 4.24 of the ArcGIS API for JavaScript (JS API) adds a referenceScale property to HeatmapRenderer. This property allows you to fix the configuration settings for a heat map at a specific scale level, making the density appear consistent at all scales.
By default, HeatmapRenderer dynamically updates the density of its surface as the user zooms in and out, making it hyper sensitive to scale. The way you configure a heat map at one scale may result in a misleading visualization at other scales.


While the effect can be confusing for the end user, this approach actually makes sense when you consider that points generally appear more dispersed as you zoom to large scales, and more dense as you zoom to small scales.
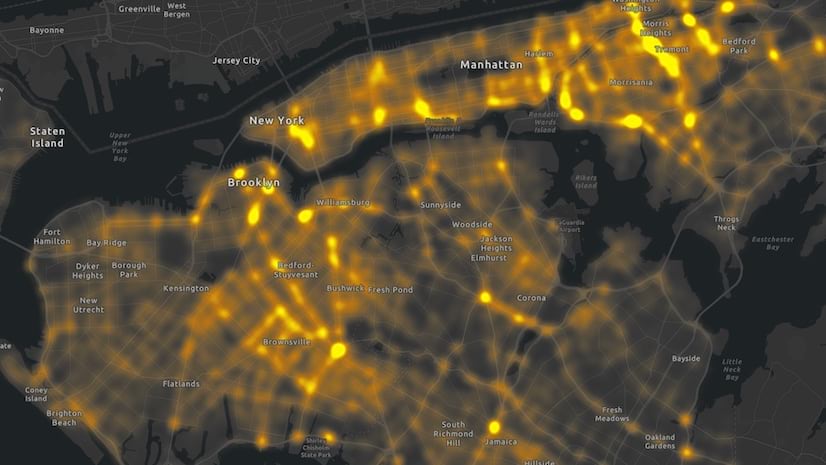
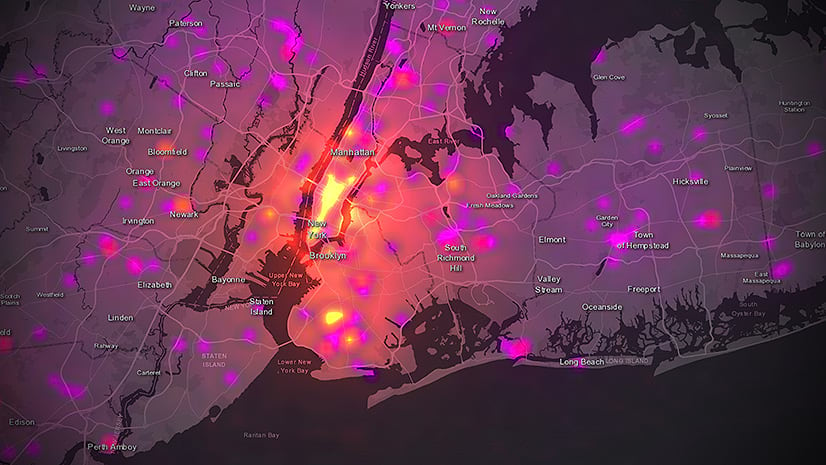
. At large scales, individual points appear dispersed; pixels are more likely to contain individual points than at small scales.")
. Pixels at small scales are more likely to contain multiple points than pixels at large scales.")
Let’s take a look at a few ways you can configure the heat map to work well at various scales…starting with the new referenceScale property.
Reference scale
The referenceScale property of a HeatmapRenderer allows you to lock the visualization to a specific scale. This has the effect of making the heat map static, so the density surface remains consistent as you zoom in and out.
The following table shows how different the same renderer looks as you zoom in and out when configured with a reference scale versus without a reference scale. Notice how the heat map looks exactly the same at the reference scale.
 heatmaps at various scales above and below the reference scale.")
To enable this behavior, simply set the referenceScale property to the view scale at which you author the heat map.
const renderer = {
  type: "heatmap",
  colorStops: [
    { color: [133, 193, 200, 0], ratio: 0 },
    // ... more color stops here ...
    { color: [255, 255, 0, 255], ratio: 1 }
  ],
  maxDensity: 0.319,
  minDensity: 0,
  radius: 6,
  // settings for heatmap apply only to this scale
  // so renderer will look consistent without
  // dynamically updating on zoom
  referenceScale: 36111
};
The following app demonstrates how the same heat map looks with and without a reference scale. Zoom in and out in to observe how the density remains constant in the initial view. Use the button above the legend to toggle off the reference scale.
Setting a reference scale works great when the user is naturally inclined to zoom out from hot spots to see more context. It is not as useful if you attempt to zoom to large scales where the heat map patterns are no longer visible. For that reason, I suggest you always use referenceScale in combination with one of the remaining techniques described below.
Navigation constraints
Constraining the maxScale of the view prevents the user from zooming in past a specific scale level.
layer.renderer = {
  type: "heatmap"
  // additional heatmap properties
}

const view = new MapView({
  container: "viewDiv",
  map: new Map({
    layers: [layer]
  }),
  constraints: {
    // prevents the user from zooming in
    // beyond a scale value
    maxScale: 33003,
    minScale: 250000
  }
});
View constraints ensure the user will never zoom too far to the point where a heat map either appears too cold or too hot. Click the “Toggle view max scale” button in the app below to get a feel for how constraining view navigation affects the user experience when zooming in and out.
Keep in mind that setting a view constraint applies globally to the view and only works well when there is no other data to view at larger scales. When the user is required to view other datasets at other scale ranges beyond the constraints, then you should use one of the other two techniques for working with scale.
Visible scale range
Setting a maxScale on the layer itself will cause the layer’s visibility to toggle off when the user zooms beyond a specific scale value.
const layer = new FeatureLayer({
  title: "Motor vehicle crashes (2020)",
  // ...other layer properties
  renderer: {
    type: "heatmap",
    // ...other heatmap properties
  },
  // layer is only visible in this scale range
  maxScale: 60494,
  minScale: 196253
});
Zoom in and out in the app below to see how this affects the user experience. Use the ScaleRangeSlider widget in the bottom right corner of the UI to adjust the visible range of the layer.
This technique works well if the data is no longer relevant at larger scale levels. If the end user still needs to see data from the heat map at large scales, then you should consider toggling from a HeatmapRenderer to a renderer showing discrete points.
Scale-dependent renderers
When the user zooms in so far that points largely appear dispersed, then it may make sense to switch the layer’s renderer to one that shows discrete locations for each point. This can be done with a SimpleRenderer, UniqueValueRenderer, ClassBreaksRenderer, or any renderer that also uses visual variables to visualize the data.
To implement this behavior, set a watch on the view’s scale property and toggle between the renderers when the threshold is crossed in either direction.
const heatmapRenderer = {
  type: "heatmap",
  // ...other heat map properties
};

const healthRenderer = {
  type: "unique-value",
  field: "health",
  // ...other unique value properties
}

// Switch layer's renderer to a unique value renderer
// to view individual points when the user zooms in
// beyond the scale threshold. Use heatmap when zooming out
view.watch("scale", (scale) => {
  layer.renderer = scale <= 9027 ? healthRenderer : heatmapRenderer;
});
Zoom closer to the streets in the app below to view individual trees locations.
Conclusion
Because HeatmapRenderer is so sensitive to scale, you should always consider the following:
- At which scale range should the heat map render?
- How should the heat map behave on zoom? Should it be locked to a reference scale?
- What should be the behavior as you zoom to large scales? Should the navigation be constrained? The layer visibility toggle off? Or should you render points?
Thanks to the new reference scale, you now have one more tool that allows you to improve how a heat map appears at various scales. I tend to favor applying all of the following techniques: set a reference scale in the renderer, set a minScale constraint on the view or layer, and setting a max scale threshold to toggle the renderer to show individual points at large scales.

Article Discussion: