Take a look under the hood of the new map viewer, and learn how you can create a similar experience using the ArcGIS API for JavaScript.
Have you played around with the new Map Viewer in ArcGIS Online yet? It offers a highly interactive mapping experience for creating impactful visualizations of your data. The good news for developers is that the pieces that come together to make the powerful data exploration tools, mapping styles, interactive filtering and popups, and even the ability to save web maps are all part of the ArcGIS API for JavaScript. That means that you can bring the same experience into your own custom apps. Let’s have a look at some of the new map viewer capabilities and dive into what powers each of them under the hood for inspiration for your next web mapping app.
Labels
Map viewer / The new map viewer offers a lot of flexibility when it comes to labels. You can use multiple label styles for different configurations; for example, increased sales numbers can be in black, while decreases are in red. You can also customize them to match your symbology, display them in multiple lines, use a font you like, and optionally specify vertical and horizontal offsets for your labels. Map rotation is also supported. When the map rotates, client-side labeling stays properly un-rotated to display upright.

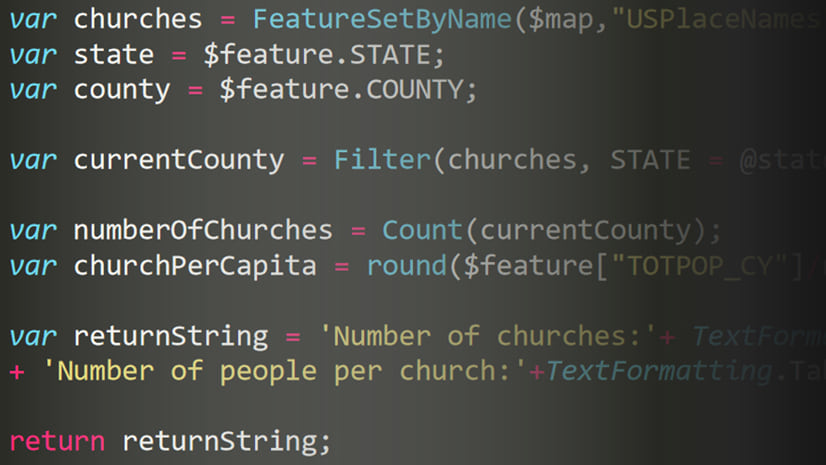
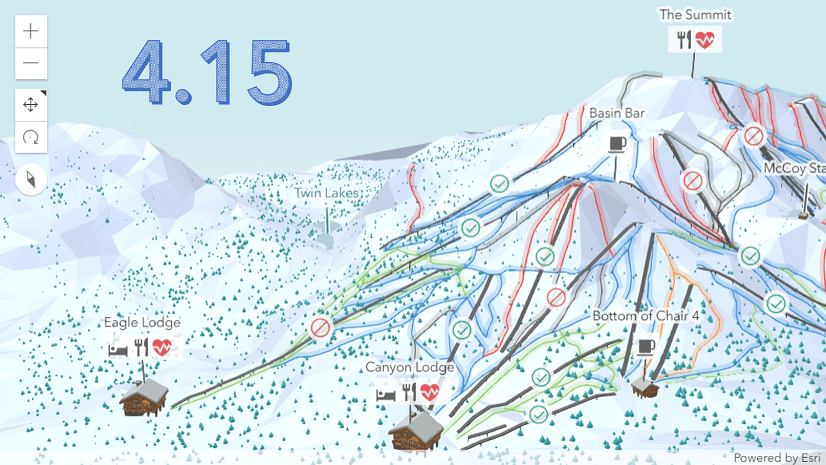
In your app / The added flexibility with labeling in the map viewer is possible due to the labeling enhancements in the JavaScript API. Developers can define where a new line is to be placed by either using TextFormatting.NewLine, in an Arcade expression, or by specifying the max width for the individual lines. Labeling styles are defined as label classes in the API and can be conditionally displayed based on criteria that includes aspects such as attribute values or scale. Conditional labeling is illustrated in this sample which shows weather conditions at weather stations.
Pop-ups
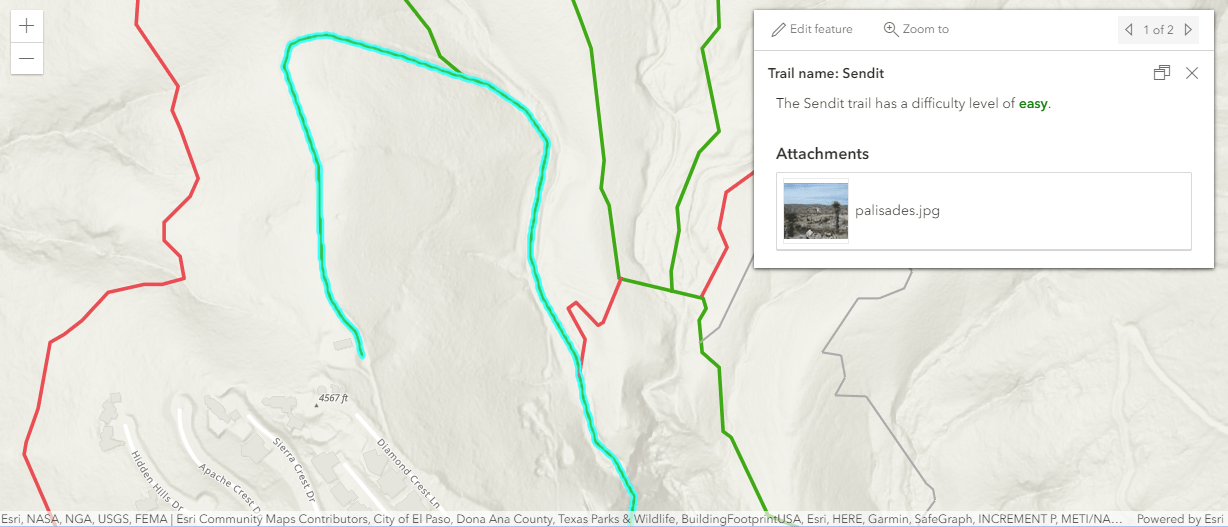
Map viewer / Popups play a key role in how your users explore the data that you have mapped. The new map viewer offers a refreshed popup experience – they are responsive, dockable, and attachments auto rotate and show thumbnails for document types.
In your app / Under the hood, popups are defined in the API using a popup template. You can organize content any way that you want, including multiple blocks of text, fields, media such as charts, and attachments. In addition, a handy innovation in the API is the concept of popup “actions.” Popup actions are a very simple way of adding a button to the popup to execute your custom code when clicked. For example, you might add an action that performs a buffer around the selected feature and locates and highlights all the POIs within that buffer. Or perhaps the action allows the user to edit the selected feature, like in the image below.
Widgets
Map viewer / The experience in the new map viewer heavily depends on API widgets. In fact, if you’ve been developing with the API, you might recognize many of them because they have been part of the API for multiple releases. However, some widgets are being developed concurrently with the map viewer as we innovate tools and workflows to assist in the mapping experience. In those cases, there is an ArcGIS Online update with new capabilities in the map viewer, and then the API is updated in a subsequent release with the new widgets. As we create new functionality in the map viewer, we want developers to have the ability to take advantage of the same widgets in their apps as well. Here are some of the widgets used by the map viewer: measure, coordinate, print, smart mapping sliders, time animation, editing, popup, search, and directions.
When a new widget is under development, the API developer teams up with a UI/UX expert to create an elegant and responsive user experience, and a product engineer who really understands the user needs and use cases. All widgets are accessible, enabling a smooth and convenient way to access tools. Widgets that were in the 3.x version of the API and present in the old map viewer get a full design refresh. One example is the print widget. The print widget available in the new map viewer offers a broader set of options with a variety of formats, sizes, and more.

In your app / API widgets enable developers to build their UI with high productivity. They are created and positioned in apps with a few lines of code. For example, the print widget is created and added to the UI like this:
var print = new Print({
    view: view
});
// Adds widget below other elements in the top left corner of the view
view.ui.add(print, {
    position: "top-left"
});
Developers can choose to style them or even pick a theme such as “dark” that will apply to all widgets in the app. More advanced developers can choose to fully customize the UI of API widgets (referred to the widget “view”) using the source code shared in GitHub.
Data exploration & fast map rendering
Tools in the Map Viewer allow you to explore and better understand your data. In fact, map creation used to be the final product of what we created. Now, with the map exploration tools available and fast map display, you can use the mapping process to better understand your data and turn it into a more meaningful information product.
Map viewer / The new map viewer maps more data with faster display than its predecessor. Tasks like changing color themes used to take 10 seconds in the old map viewer and now they are instantaneous. This gives the user the ability to get creative without paying a penalty in terms of productivity. What’s more, it gives you the ability to play around with a variety of smart mapping styles with seemingly immediate map updates. You can also change between attributes that you want to use to drive the visualization.
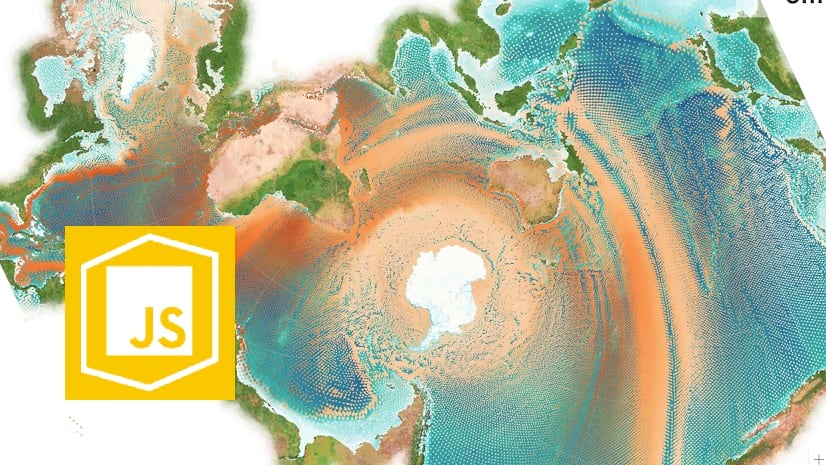
In your app / The API leverages hardware acceleration via WebGL to render anything from small to very large datasets with fast performance. WebGL also allows attribute values used to render each feature to be updated without reprocessing the geometries. So the graphics can be updated very fast without noticeable artifacts or flashing. You can build a great user experience using this capability. For example, if you’d like to build an app that allows your end users to thematically map an area of interest based on a variety of data points, you can give them the tools to dynamically switch between attributes and rendering styles, and the map will update instantaneously.
Smart mapping
Map viewer / Smart Mapping capabilities in the map viewer help you create a quality visualization by default. It automatically picks a color scheme that matches your basemap (for any raster or vector basemap). You can then keep the styling as-is, change it to another color ramp, or modify it any way you see fit.
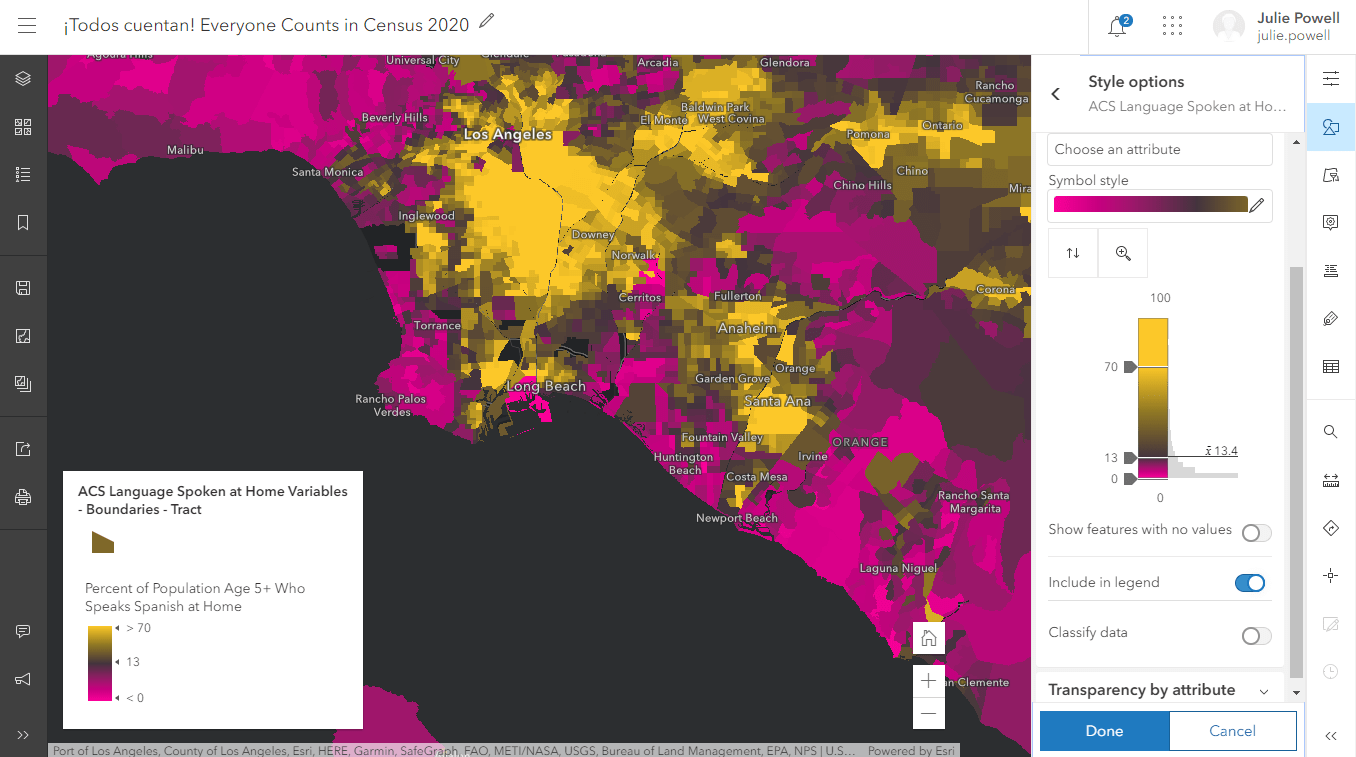
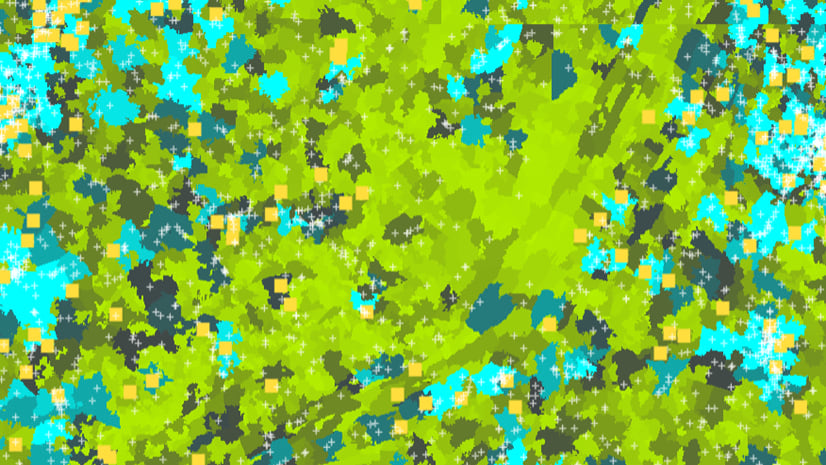
In your app / The API exposes the Smart Mapping API that the map viewer uses under the hood. Using this functionality, you can create map exploration tools in your app. For example, you might want to give your end users the ability to select from a list of attributes to thematically map like in this dot density visualization. When they select an attribute, the smart mapping tools can automatically select a style that works well with the data and the basemap.
Data filtering
Map viewer / Immediate feedback and interactive filtering help you explore the data on the map and find the data you are interested in. Statistics about the field are also displayed, such as the count of the records, sum, minimum, maximum, average. While authoring your filter, the map is updated to display where your data matches your filter and where it doesn’t by visually de-emphasizing features that are outside your current filter.
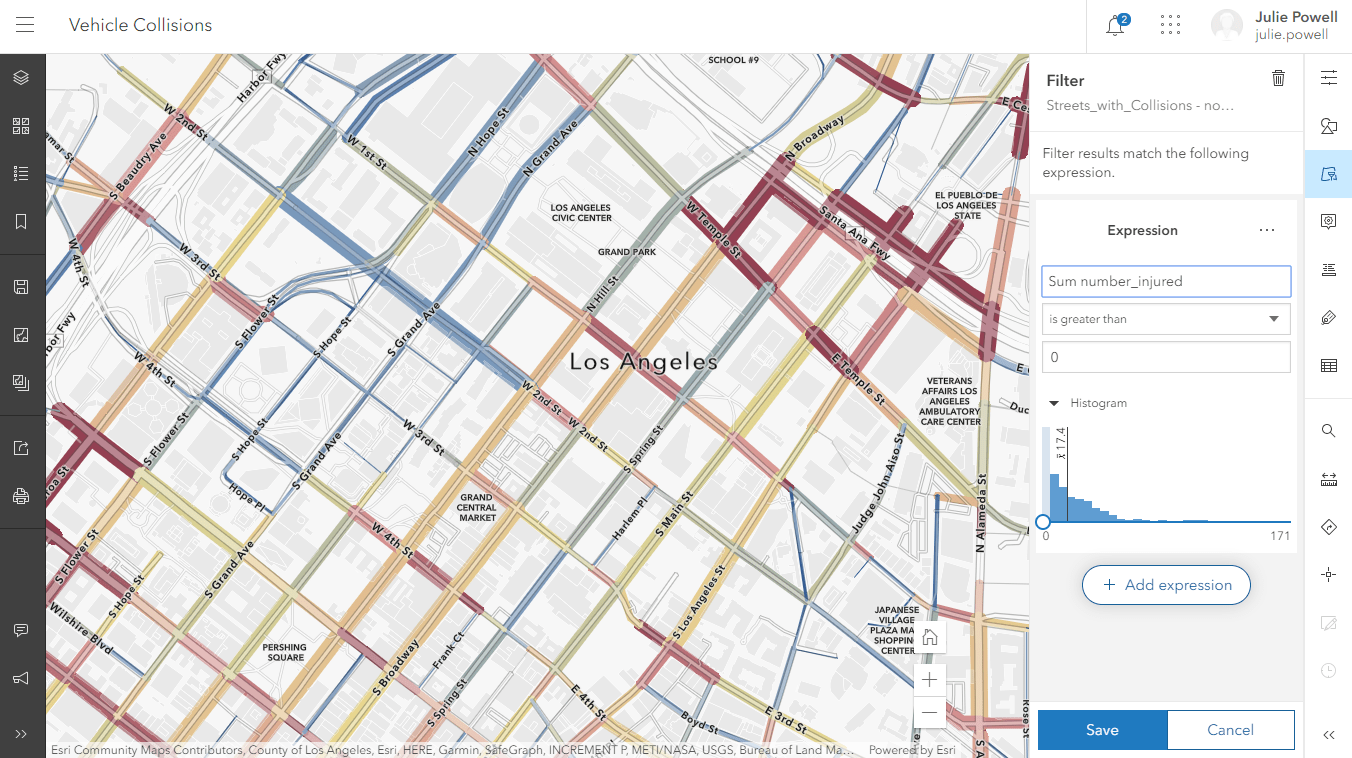
In your app / The JavaScript API contains an in-memory database that allows you to perform client-side filtering, querying, and perform statistical calculations in 2D maps and 3D scenes. In fact, it can process any SQL where clause and spatial relationship operation that can be done in a server-side query. Since everything is performed client-side, you can create an experience with immediate feedback to your end users.
The world of vector basemaps
ArcGIS Online provides a variety of vector tile basemaps. One of the benefits of vector tiles is that they have a crisp display on any screen resolution, which can vary across devices. Also, because the vector data and the visual style are separate, vector tile layers can be customized to the map, which drives dynamic, interactive cartography. The process for creating and updating vector tile layers is a lot faster than raster so Esri is able to make frequent updates to vector tile basemaps.
Map viewer / The new map viewer’s default set of basemaps are vector (as opposed to raster). You can make a copy of one of the basemaps and style any aspect of it using the vector tile style editor that can be used standalone or accessed from within the map viewer.
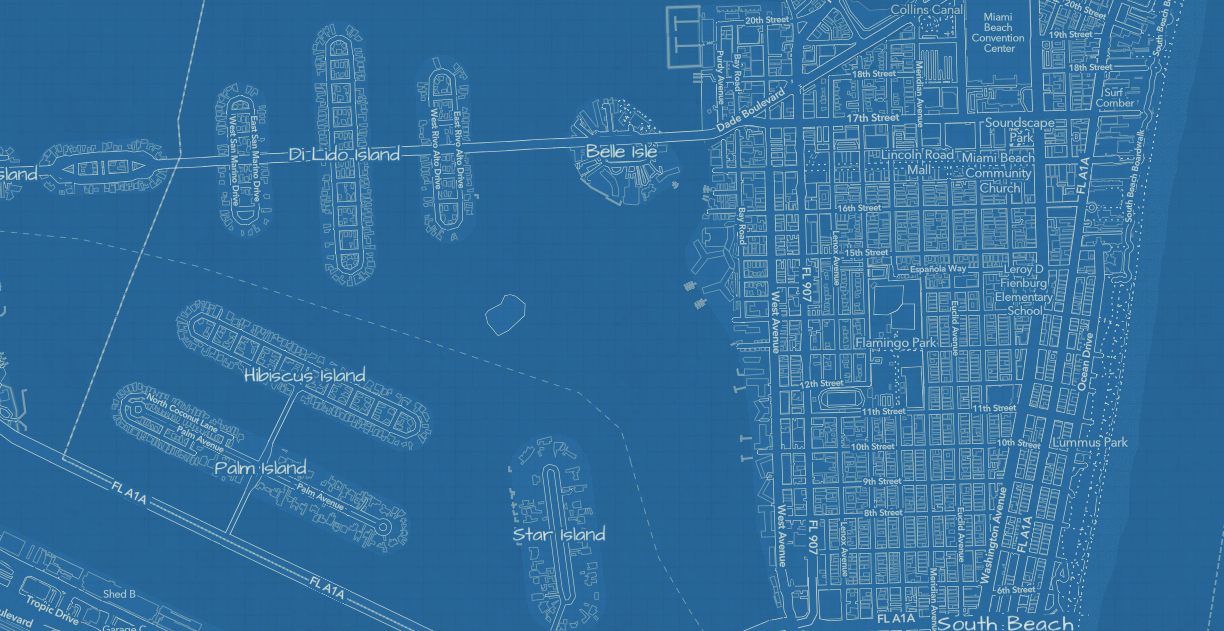
In your app / You can bring any vector tile layer into the JavaScript API – either with its default style, or with a custom style that you’ve created. The API also gives you the ability to dynamically change the style via code.
Creating and updating web maps
Map viewer / The map viewer saves your cartography work of art in the form of a web map. The web map is a configuration of layers, style information, pop-ups, view state such as initial extent, and more. The power of the web map is that it can be defined once using a simple authoring experience, and it is consistently displayed in all ArcGIS clients with little effort.
In your app / The API has the same web map saving capabilities that the new map view has; in fact, when it is time to save, the map viewer calls the API method webmap.save() and webmap.saveAs(). While this might seem trivial, this gives you the power to create simplified or more focused workflows for web map authoring from within your own product. This can be bigger changes like adding or removing a layer, updating the rendering, or smaller details like saving the view state.
Play and get inspired!
The new map viewer is growing and evolving with each release. As new features are added, they also become part of the API if they aren’t already available. We welcome you to play around in the new map viewer and see what you like – then go look in the JavaScript API samples and see how you can build the same capabilities in your app!

Article Discussion: