Build web apps with striking visualizations and interactive workflows using GeoJSON, CSV, OGC, and any tiled layer with the ArcGIS API for JavaScript
The ArcGIS API for JavaScript is flexible and interoperable. It enables you to build web apps with striking visualizations and interactive workflows using all kinds of data formats.
You can load GeoJSON and comma-separated values (CSV) files, and Open Geospatial Consortium, Inc. (OGC) services, and use third-party basemaps with a few lines of code and style them just as you would any ArcGIS layer type. Once you have the layer in your app, the world is your oyster. You can build a great user experience using client-side querying, statistical calculations, filtering, and geometric operations. Because a variety of open format layer types are fully integrated into the ArcGIS API for JavaScript, you can build your user interface (UI) using API widgets that work with these layers.
Using GeoJSON in your web apps
GeoJSON was developed in 2008 through community discussion and consensus to include spatial data in the newly popular JavaScript Object Notation (JSON) format. GeoJSON offered web developers an easy way to extend existing APIs. It has been widely adopted across a variety of services, such as GitHub and Twitter, and is used in visualization tools such as Data-Driven Documents (D3). Due to its popularity and interoperability, developers continue to build apps that bring in features represented as GeoJSON.
From the initial release of the ArcGIS API for JavaScript, developers could build web mapping apps that consume GeoJSON directly, but they had to do a little work. Consuming GeoJSON required creating a custom layer in the map and manually loading, parsing, and styling features. GeoJSON uses World Geodetic System 1984 (WGS84), a geographic coordinate reference system, so the map was limited to WGS84 or Web Mercator spatial references. Using another coordinate reference system would mean additional effort.
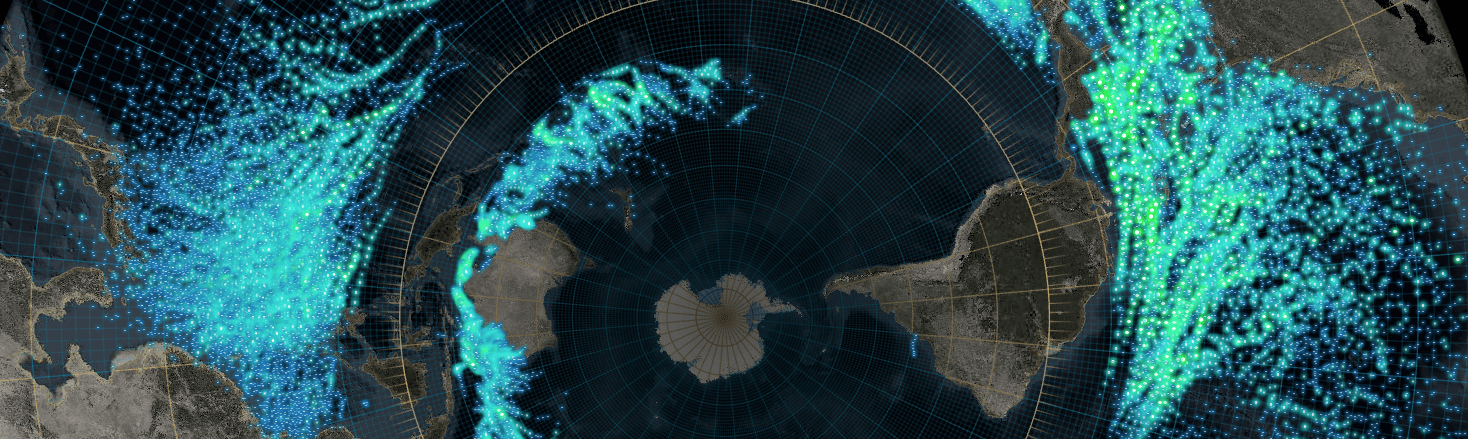
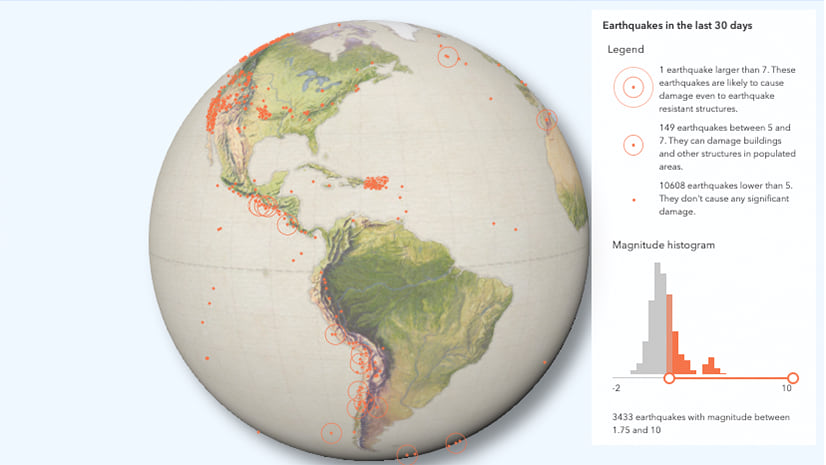
The ArcGIS API for JavaScript has evolved. It now provides a GeoJSON layer to fully support GeoJSON data sources. The GeoJSON layer allows you to easily pull in GeoJSON data by referencing the URL and adding the layer to the map (Fig. 1).
const geojsonLayer = new GeoJSONLayer({
    url: "https://earthquake.usgs.gov/earthquakes/feed/v1.0/summary/all_month.geojson"
});
All the loading and parsing is handled by the API. Since the API has a client-side projection engine, it will automatically project the data to the map’s coordinate system as needed. While GeoJSON data is limited to WGS84, your map or basemap isn’t. It can be in any projection.
The fun doesn’t end there. You can add pop-ups and labels and style features using the same techniques you use to visualize data in other layer types. You control how each attribute in GeoJSON data drives the color, size, opacity, and rotation of features. All smart mapping capabilities are available with GeoJSON layers.
Handy tip: The above code loads the GeoJSON data by referencing a URL to the file. If you’d rather load a GeoJSON object into the layer, you can do that by creating a blob:
const blob = new Blob([JSON.stringify(geojson)], {type: "application/json"});
const url  = URL.createObjectURL(blob);
const layer = new GeoJSONLayer({ url });
Data in 2D, 3D, or Both
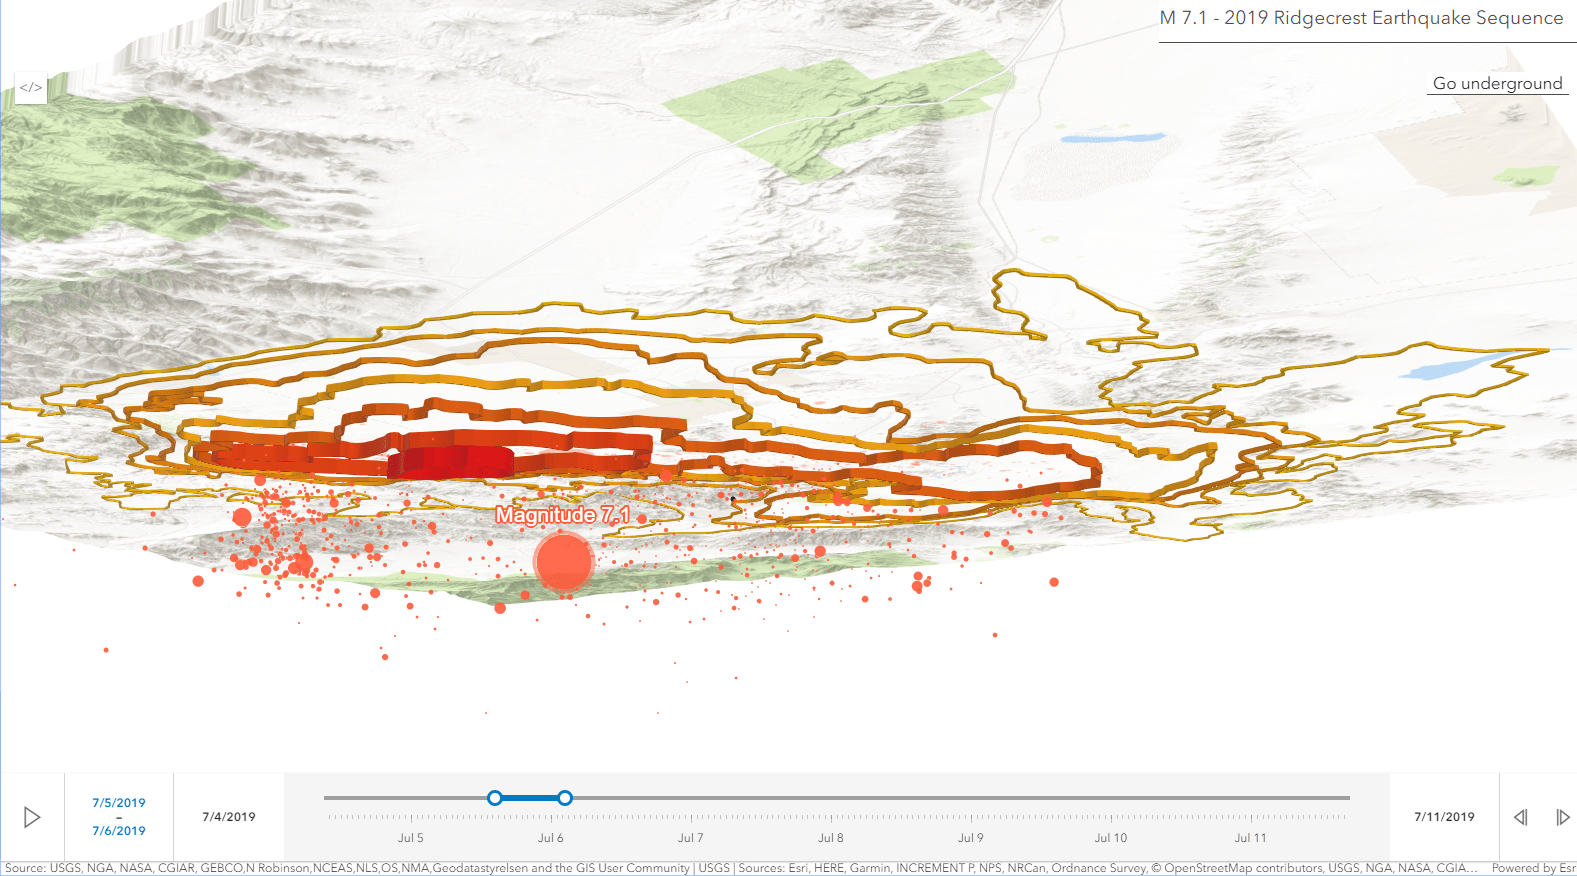
The ArcGIS API for JavaScript is multidimensional. You can choose to visualize data in 2D or 3D or give your users the option to interact with data in both 2D and 3D. Changing the code from a MapView to a SceneView will display the data in 3D. You can leave its appearance as is or style the layer with 3D symbols so it will nicely display on a 3D globe. With the ability to use elevation and high-resolution models, SceneView based mapping applications can appear more realistic, and more importantly, more compelling to you and your users.
For example, the US Geological Survey earthquake feed includes elevation information that provides the distance below the earth’s surface. You can use the elevation information to set the depth of each feature and interact with the data underground in a 3D scene. Take it a step further and use the magnitude of the earthquake to drive the size and color of the features. Looking at the visualization below, you can really get a sense of the movement going on below the surface, even if you didn’t feel the shaking.
With your layer set up, you decide what map interaction you’d like to enable in your app. The GeoJSON layer loads all data at once to the client. You can build a very interactive experience using the API’s client-side querying, statistics, filtering, and geometric analysis.
What about ArcGIS Online and ArcGIS Enterprise?
Many organizations want to make their data available as GeoJSON (often along with other formats) so that any client that supports GeoJSON can consume this data as well as create and style layers in web maps from third-party GeoJSON sources. ArcGIS Online and ArcGIS Enterprise support GeoJSON as a format you can use to upload to create new hosted services in web maps, download existing content, or get query results.
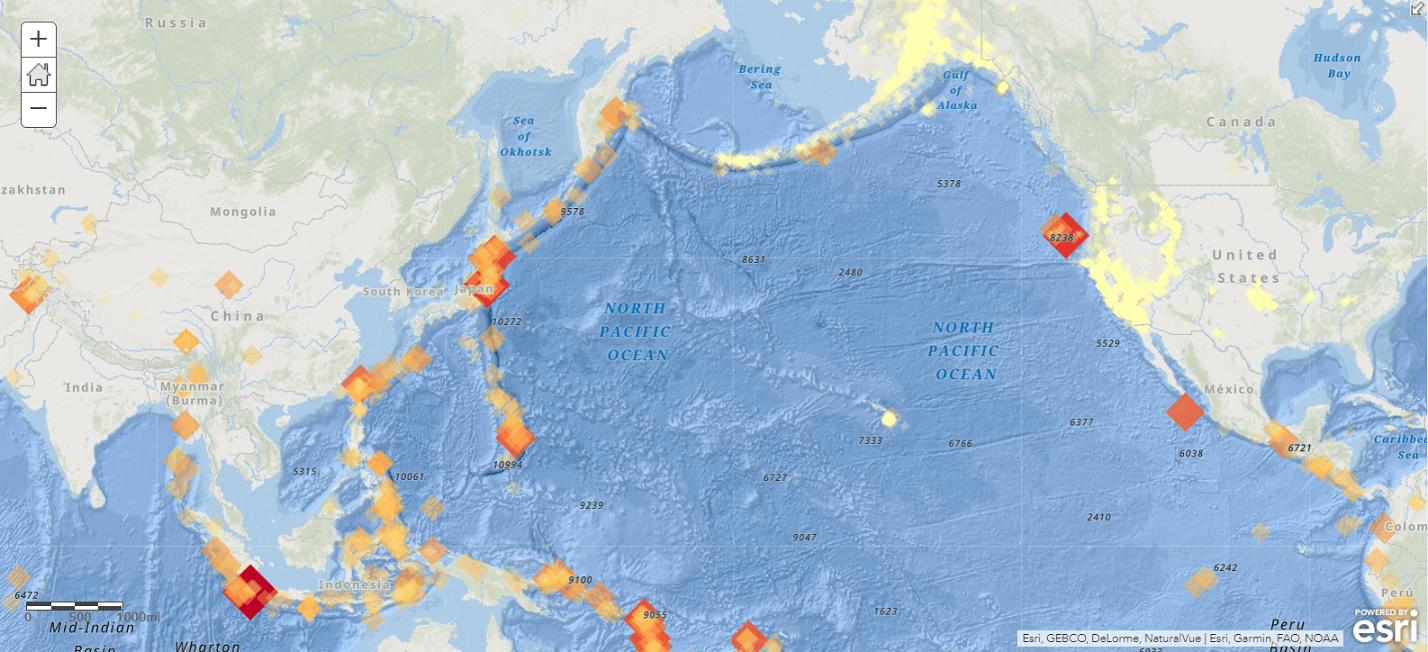
Bring CSV Data to Life
CSV is a plain-text file format used to represent tabular data, including geographic point features (i.e., latitude and longitude). Because of its simple structure, CSV is easy to generate, import, and export from programs that store data in tables such as Microsoft Excel. However, if you want to understand spatial patterns in data, it’s nearly impossible in a tabular format. If a CSV file has location data—place information, addresses, or x,y coordinates—you can map it. You can do everything with CSV that you can with GeoJSON.
There are a few ways to bring CSV data into your app. You can use the API’s CSV layer to load the CSV by specifying the URL where the file is stored:
const csvLayer = new CSVLayer({
    url: "https://developers.arcgis.com/javascript/latest/sample-code/layers-csv/live/earthquakes.csv"
});
Note that the CSV layer expects latitude, longitude coordinates. If the basemap and the CSV data have different spatial references, the CSV data will automatically be reprojected on the client-side, as with GeoJSON.
Another way to bring in CSV data is via a layer or web map you create in ArcGIS Online or ArcGIS Enterprise. An easy way to do it is by uploading the CSV file and creating a hosted feature layer, and then loading it in your app using the item’s ID:
var lyr = new FeatureLayer({
    portalItem: {
      id: "caa9bd9da1f4487cb4989824053bb847"
    }
});
If the CSV data has addresses or place-names, it will be geocoded. Once the data is in your map, you can use smart mapping tools to style the layer, add pop-ups, and do other things. The saved layer or web map can be loaded into your app as usual and the API will apply anything that has been configured.
OGC Services
Using OGC services and encodings enables open access to geographic data and software functionality, allowing organizations to incorporate GIS data and services into any app on a variety of computing and mobile devices. These open services and encodings improve the sharing and interoperability of geospatial information. With ArcGIS, you can publish your data as OGC endpoints as well as ArcGIS service types. For example, you can publish a hosted Web Map Tile Service (WMTS) from a tiled layer in ArcGIS Online or ArcGIS Enterprise.
A smart practice is to enable both the ArcGIS and OGC service types so that client apps that are built with ArcGIS service types can benefit from performance and capability advantages, while non-ArcGIS clients can still interface with the OGC service types.
OGC layers can be added to your web app directly in your code or from portal items on AGOL (or ArcGIS Enterprise) that represent published webmaps or layers. Load these layers with a few lines of code or by manually creating layers in your app that directly reference the services. The ArcGIS API for JavaScript supports Web Map Service (WMS), WMTS, WFS (available in version 3.x and coming soon in 4.x), and KML. OGC layers are well integrated into the API. For example, the design of the WMS layer was modeled after the ArcGIS dynamic service-based map image layer. You can work with WMS sublayers in a way that is very similar to how you work with map image layer sublayers. These layer types, in addition to any sublayers, will be displayed in the legend and layer list widgets. If you want to change the visibility of a WMS sublayer, check or uncheck the layer in the layer list.
Use Any Tiled Layer from Anywhere
You can use a basemap from the variety of vector and raster basemaps available with ArcGIS Online or a basemap you published. You can also use a non-ArcGIS basemap in 2D or 3D, whether it is a raster or vector basemap.
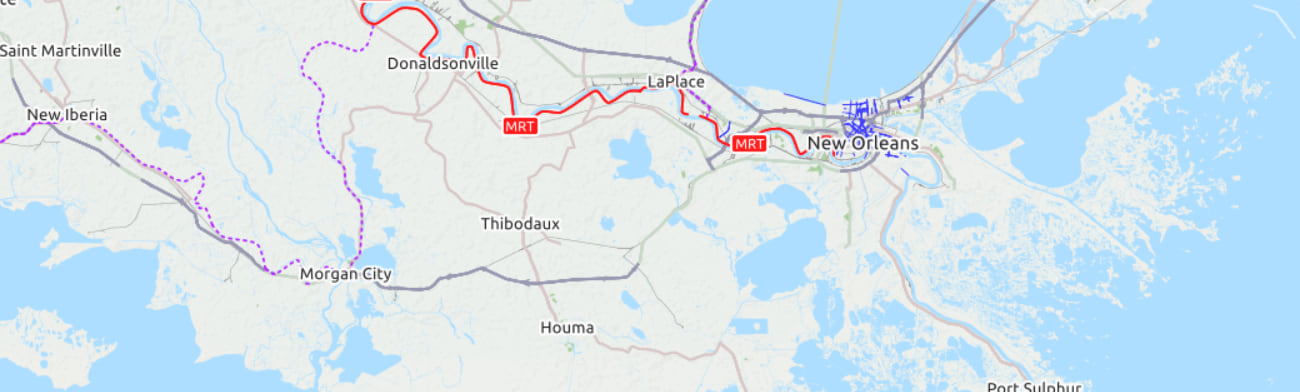
To use a third-party raster basemap, the API’s web tile layer provides a simple way to add non-ArcGIS map tiles as a layer to a map. At minimum the third party service must accept a level, col and row so that tiles can be requested by the map for specified tiles. The web tile layer allows the developer to define how these web requests are constructed, for example: https://some.domain.com/{level}/{col}/{row}/, where level corresponds to a zoom level, and col and row represent tile column and row. This pattern is not required but is the one most commonly used on the web.
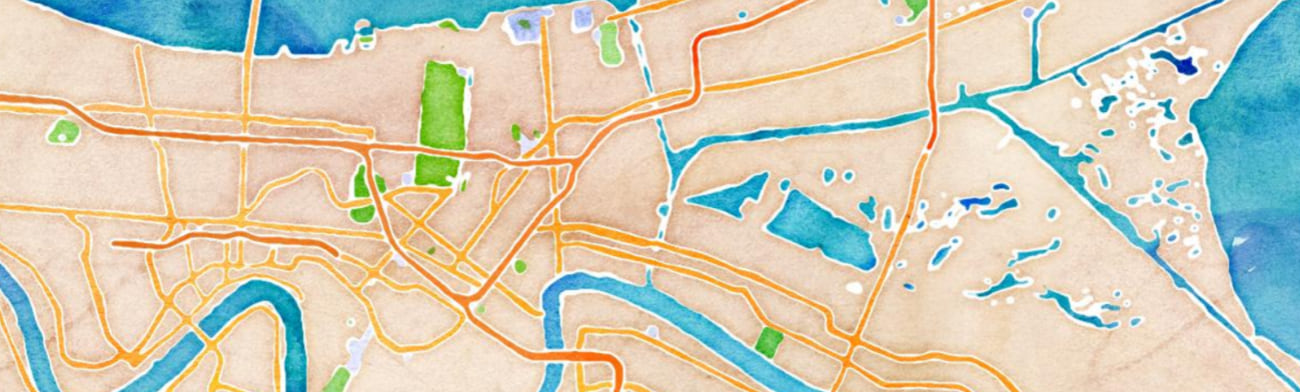
To use a vector basemap, you can load it into the API, regardless of its origin. The vector tile layer consumes vector tiles and is styled using a common style specification. Explore the ArcGIS API for JavaScript samples on developers.arcgis.com to see how you can work with GeoJSON, CSV, OGC, and tiled layer types. If you open a sample in the sandbox, you can substitute one of the services with one that you want to use, refresh the map, and see it display.
For example, you can bring in a Stamen watercolor basemap or OpenCycleMap.
Learn about Esri’s vision of an open, flexible, and interoperable platform that supports innovation.

Commenting is not enabled for this article.