At last month’s Adobe MAX 2017, I had the opportunity to present how easy it is to make data-driven maps in the new Version 1.1 of the ArcGIS Maps for Creative Cloud (M4CC) extension.The audience was fantastic! One of the things I really appreciated about this audience was that the majority was made up of designers who did not come from a cartography background, yet they still were eager to integrate maps in their great design work. Their keen eye for design can produce spectacular looking maps.

Here is the demo that I shared to make a Top Ten Locations map with the M4CC extension in Illustrator:
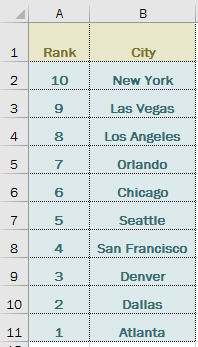
Below is Expedia’s list of the ten busiest Labor Day destinations, which can also be found in this article by PR Newswire.
- New York
- Las Vegas
- Los Angeles
- Orlando
- Chicago
- Seattle
- San Francisco
- Denver
- Dallas
- Atlanta
While this list is informative on its own, a map of these Top 10 cities could add some useful visual context for this article’s readers. Here is how I turned this list of cities into a “Top 10 Locations” map.
Step 1 – Create a CSV file of the ten cities
The first quick step was to recreate this list of 10 cities in a program like Excel, and then save as a Comma Separated Value – or CSV – file. In the article, the list is ordered where 1 is the most visited city, and 10 is the 10th-most visited city. But since I wanted to put the cities as points on a map, and then make the city points’ sizes based upon some sort of rank column in the CSV file, I flipped this order as follows: Since New York city needs to be the biggest point, I’ve flipped the order of this Rank column, so that the most visited city has the highest rank, the second most visited city has the second highest rank, and so on. Then I saved the CSV file, and closed it.
Step 2 – Define the map area by drawing a mapboard
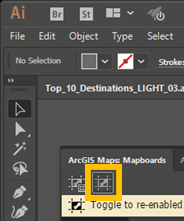
In Illustrator, you can open the M4CC extension (Windows –> Extension –> ArcGIS Maps for Adobe Creative Cloud), and go to the Mapboards tab to define your map area by zooming and panning in/out until you are happy with the map, and then clicking on the mapboard tool to draw your extent over the area you want to map. Since this list of destinations is all in the lower 48 United States, that is where I defined my mapboard.
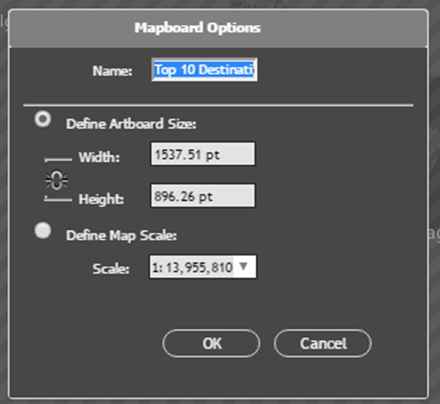
I was prompted to name my mapboard and had options to change the map dimensions and map scale. Note that changing the dimensions and scale can change your map’s extent. If this occurs, you can also manually readjust the extent again.
Step 3 – Add some layers to the map
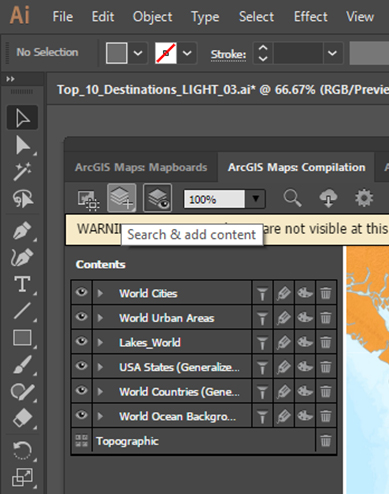
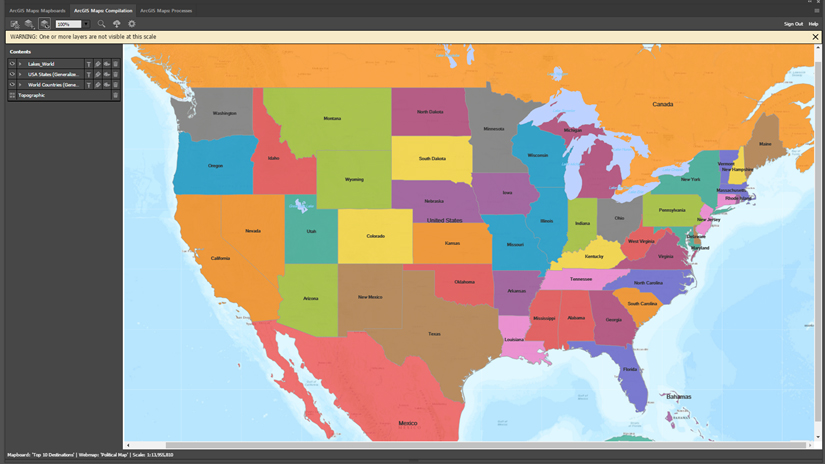
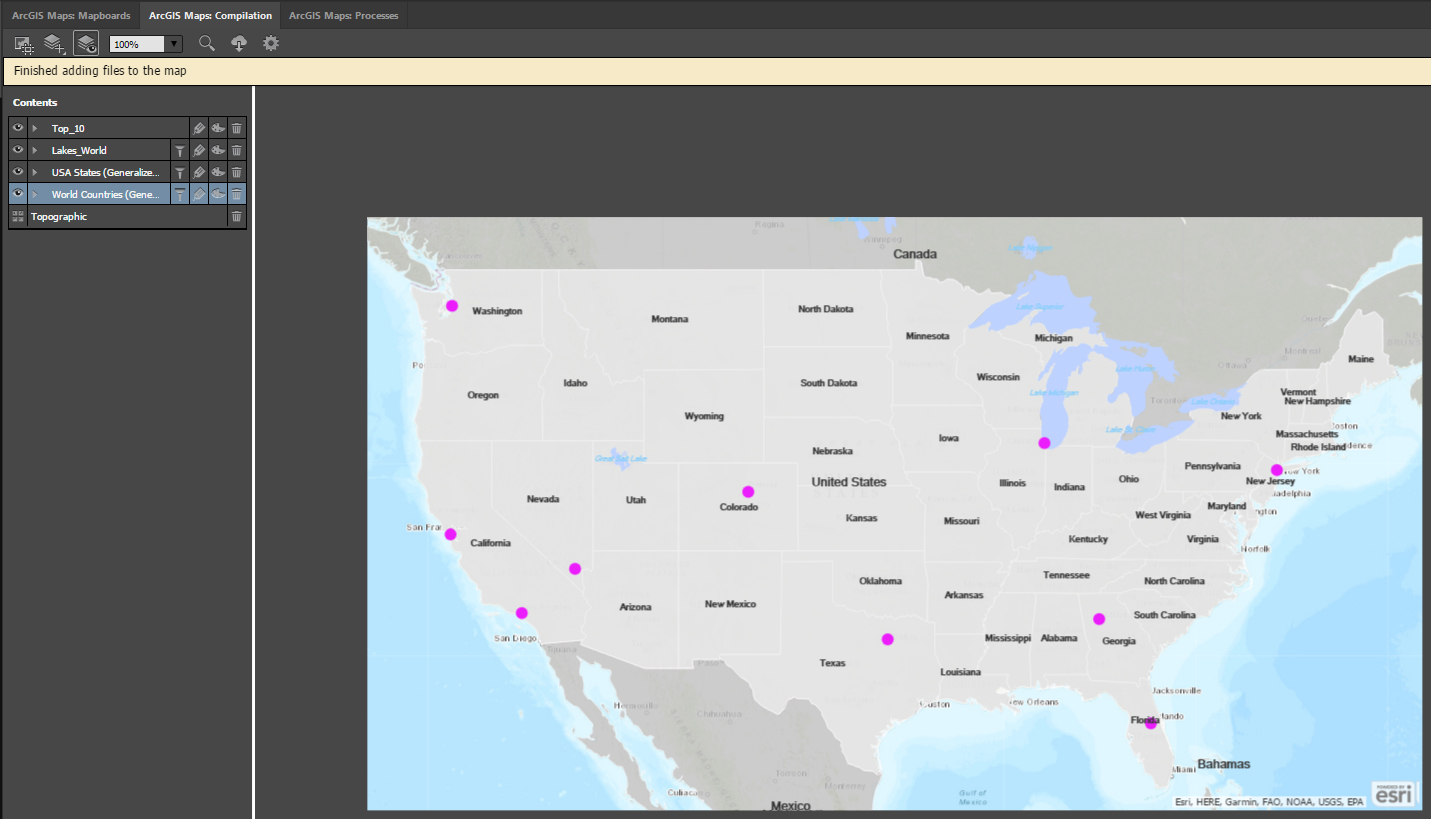
By clicking on the Compilation tab, I added layers that fit the purpose of my map. For my demo at Adobe MAX, I chose the option Overwrite from Map from the Choose and Add Layers button. I selected a web map called “Political Map” which contains country boundaries, US state boundaries, and a few other layers. The image below shows the Choose and Add Layers button as well as the layers that come with this map added to my Compilation. I deleted “World cities,” “World Urban Areas,” and “Ocean Background” from my contents since I didn’t want those layers in the downloaded map. Here is a helpful piece on on adding data to the Compilation window.
Now my map and contents looked like this image below (click to enlarge). Since I also needed to add that CSV file from step 1 to this map before I download, I wanted to make the cities in this CSV file easier to see. You can do some pre-styling to your map in this extension before downloading into Illustrator.
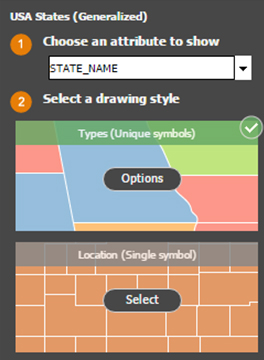
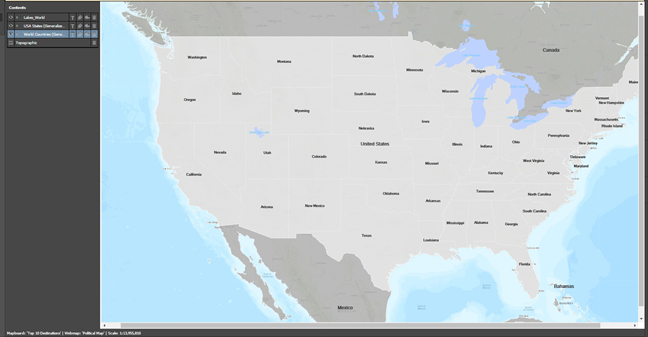
- Click on the painter’s palette symbol in the layer name of any layer in the Contents to symbolize in Illustrator. This will allow you to symbolize by an attribute (which is covered in step 5), or just choose to symbolize by location so that each feature in the layer will have the same symbol. For changing the colors of the states to a neutral gray, I chose the “Location (Single symbol)” option (see first image below), then clicked “Options”, to chose a light gray from the color options that appear. I did the same thing for the World Countries layer. Now my map looks like the second image below:
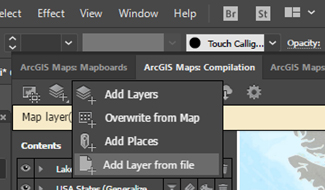
Step 4 – Add the CSV file that you created
To add my CSV file from step 1, I used the “Search and Add Content” button. This time I chose “Add Layer from file.” This option will allow you to browse to the location where you have saved .TXT files, .CSV files, and zipped shapefiles to add to your map. Then just select your file and click “Open.” For my list of Top 10 Cities, ArcGIS automatically knew where these large cities are located. The second image below (click to enlarge) illustrates the automatic placement after adding the CSV file to the map.
All the cities are the same size point. So I accessed ArcGIS Online’s Smart Mapping tools to symbolize this layer based upon the data.
Step 5 – Graduated Symbology
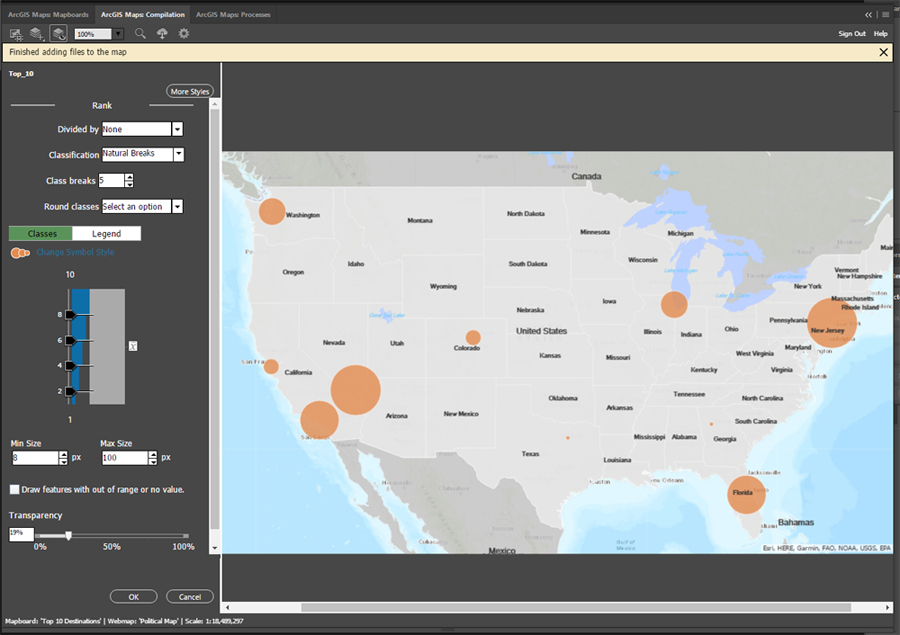
I clicked the Change Style button (painter’s palette) on the new city points layer to bring up the ArcGIS Smart Mapping options for this layer. Since the cities’ sizes should be based upon the magnitude of visitation during Labor Day, the “Rank” column from the Choose an attribute to show dropdown was selected. This indicates that the points will be symbolized by that attribute. The image below (click to enlarge) shows the default graduated symbology that is automatically applied by choosing to symbolize by the “Rank” column.

The difference in symbol size between the least visited city and most visited city is not that large. To make it absolutely clear, I chose to increase the difference in these symbols’ size by choosing the Options from Counts and Amounts (Size) in the image above.
The options that appear allow for some pretty detailed statistical symbology. Users can choose to add or subtract the amount of class breaks, which will give them more (or fewer) categories by which their data can be symbolized. I left this as the default amount, which was 5. Users can also change the minimum and maximum sizes of their graduated symbology. I kept the minimum at 8 pixels, and increased the maximum to 100 pixels.
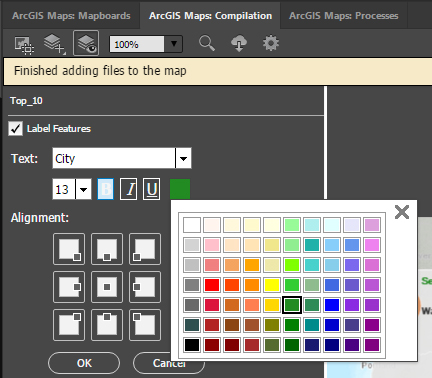
Step 6 – Adding Labels to the new graduated symbology
This extension allows you to add labels to your map. These labels will be downloaded with your map as easily editable text. To label these graduated symbols, I just clicked the Manage Lables button next to the cities’ layer “Top 10.” By default, the “City” column from the CSV file’s data is used to create labels, which is great since that column contains the city names. To make these city labels easily differentiated in my downloaded map, I changed the color of these labels in this Manage Labels window by clicking the color icon.
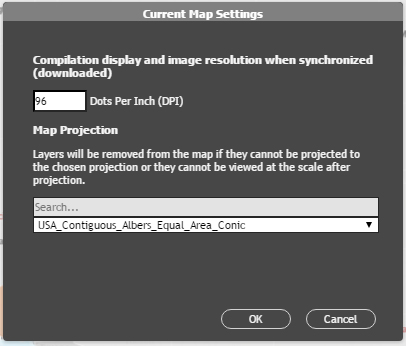
Optional Step – Change the projection
Mappers can choose from many different projections with the M4CC extension. Since my map is over the contiguous United States, I chose the USA Contiguous Albers Equal Area Conic from the map settings options’ Map Projection dropdown. To change the map projection, just click on the Settings button in the top toolbar of the compilation window. Give the extension a moment to reproject your data depending on the amount.
Note:If you still have a raster basemap in your contents, it will be removed from your map once you reproject your map.
Step 7 – Download and apply your design skills!
Once I was done with step 6, my map was ready to download into Illustrator. I also did the optional step of reprojecting. To download my map, I just clicked the Sync (cloud icon seen in the optional step above) button. Here is the results of my download prior to adding any design in Illustrator:
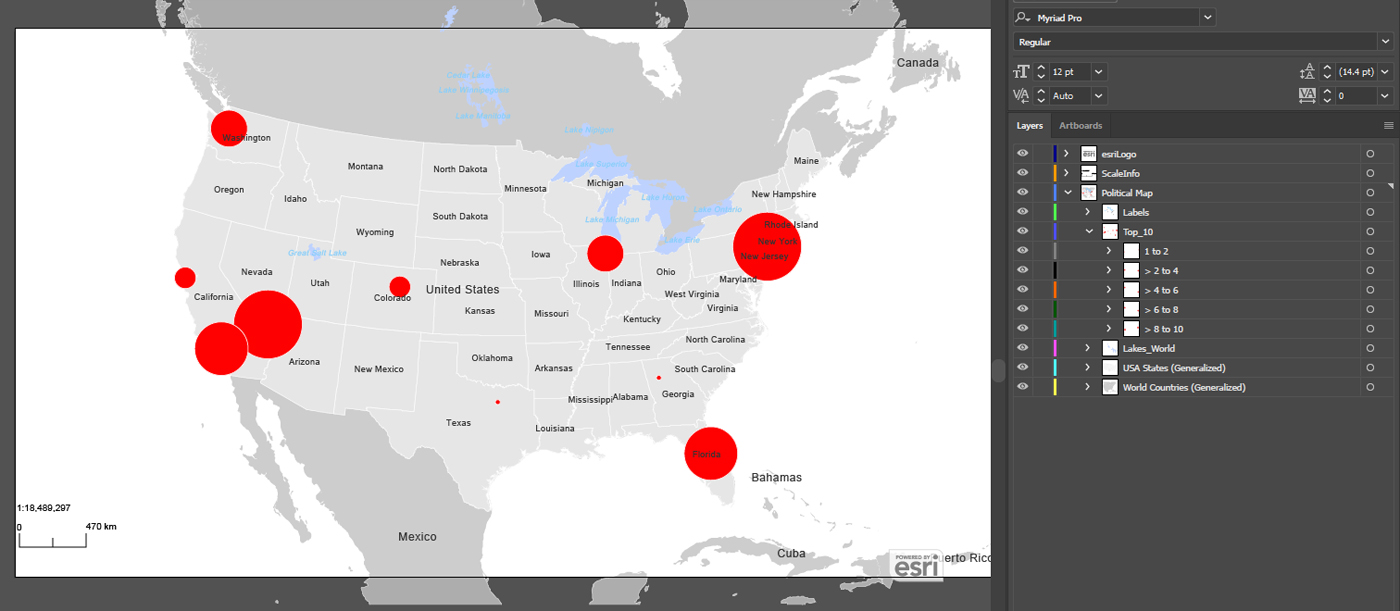
Notice that the “Top_10” layer is categorized by the categories that I defined in step 5. This organization can be really useful for design efficiency, especially if you have many symbols to manage.
Here is the final result that I shared with the Adobe MAX 2017 audience:

Commenting is not enabled for this article.