By Aileen Buckley, Mapping Center Lead
We recently received a request for some help on tables on Ask a Cartographer. We thought we could pass along some of the tips in a blog entry as well, especially as there is currently limited info in our online help about tables (but we are working on changing that!) Here are a dozen elementary but critical “how to’s” for working with tables in a page layout.
1. What are the basic concepts that relate to tables in a layout view?
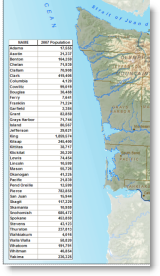
A table is a display of attribute information in a tabular format. The information displayed in a table comes directly from the attribute information stored with your geographic data. The table contents will update if you make a change to the attribute table.
Tables are different from reports, which are derived from a table in your map and then stored in the format of a graphic element (so they are not “live-linked”, so to speak). Once you’ve created a report, you can place it on your map layout or save it as a file for distributions.
2. How do you add a table to a page layout?
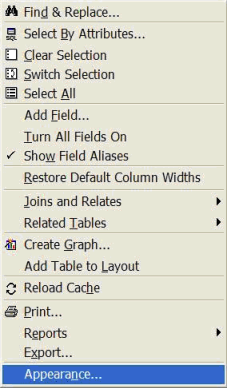
Open the attribute table that you want to create the report from, click the Options button on the bottom of the Attribute table window, and select the option to “Add Table to Layout“.
If the Options menu button is hidden due to the width of the table window, a small down arrow appears at the bottom right corner of the window. You can click this to access the Options menu. You can also right-click any of the empty gray space at the bottom or to the right of the table to access the Options menu.
3. How do you change the appearance of the table?
The appearance of the table in the table window defines how it will look on the layout. Once added, any additional formatting to the table window won’t affect its display on the layout. Thus, you’ll want to do things like set the text font and size before you add the table to the layout. There are three ways to change the appearance of a table: 1) interactively from the Attribute table window, 2) using the options on the Fields tab of the Layer Properties dialog, and 3) using the Tools > Options > Tables settings.
It is important to note that the first two options change the appearance of a single table and the third option changes the appearance of all tables. Settings applied to the Options dialog box accessed from the Tools menu will apply to all tables you work with in all ArcGIS Desktop applications. Changes in these settings affect all the applications. Any changes apply to new table windows you open, but not to table windows you have already opened. To change the setting for a table window you have already opened, make your changes in the Attribute table window.
You can add several table frames from a single table to a layout, but once you’ve added a table frame to a layout, you can’t change its appearance. Instead, delete the table frame, make adjustments to the appearance of the table window, then add the table to the layout again.
3.a. Changing the appearance of a table in the Attribute table window
You have limited options for changing the appearance of the table in the Attribute table window. These are described in the online help (see “About setting field properties and aliases“). To change the appearance of the table, click the Options button on the bottom of the Attribute Table window, and select the “Appearance…” option.
Some of the display options you can set include:
- Changing the color or font that is used to display attributes in tables
- Choosing whether to show the values or the descriptions for fields with subtypes or domains
In addition you can change the appearance of the table by right clicking it and using the options to sort the values in fields as well as turn fields on or off.
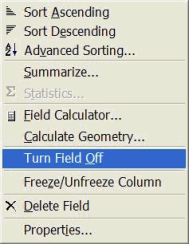
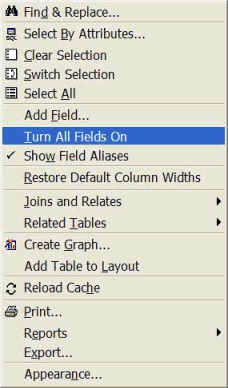
Note that once you turn a field or fields off, you can turn them back on by clicking the Options button on the bottom of the Attribute Table widow and select the option to “Turn All Fields On”.
On the Attribute table window, you can also resize the column widths by simply dragging the column edges to the left or right. And a little known fact (at least to me!) is that you can change the order of the fields by first clicking on the field you want to move, then clicking, holding and dragging it to its new location. The red line between the field names indicates the new starting position of the field.
3.b. Changing the appearance of a table using the options on the Fields tab of the Layer Properties dialog
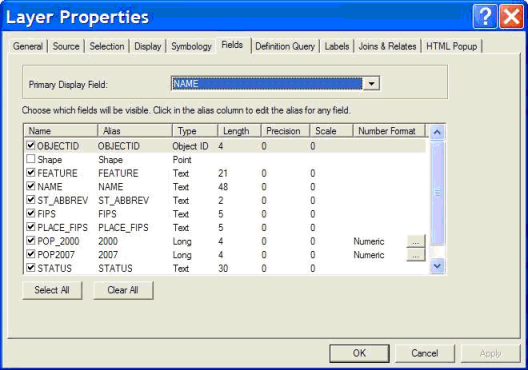
Another way to change the appearance of the table is to change its properties using the Layer Properties dialog. On the Fields tab, you can check the visibility of the fields on and off and change the field aliases.
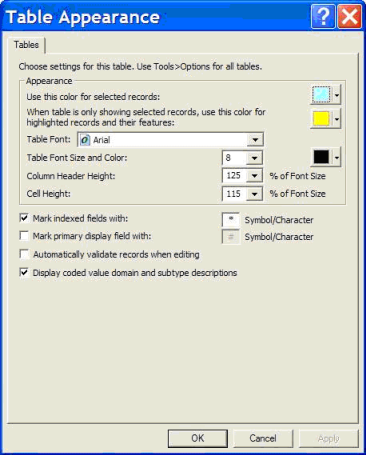
Changing the appearance of a table using Table settings As noted above, changes to these settings will affect the appearance of all tables you work with in all ArcGIS Desktop applications. (Think of these as the default setting for all tables.) Settings applied from the Appearance command in the Options menu on a table window will apply to the current table you are working with. To change the appearance of a table using Table settings, click the Tools menu, click Options, and click the Tables tab.
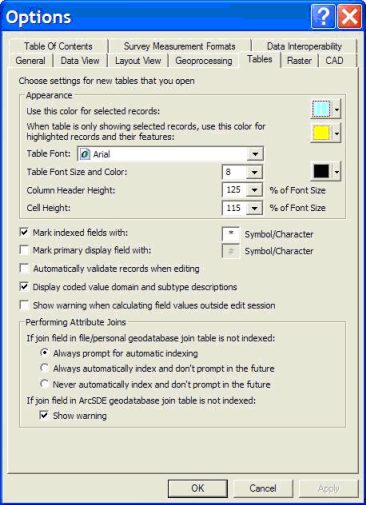
Here you can set:
- the text font, size, and color
- the column header height at the top of the table and the height of rows in the table (as a percentage of font size). You should normally leave the default column header height at 125% and the default cell height at 115%, so all the new tables you create use this standard setting. If you want a particular table to have taller rows so long text fields wrap, specify the setting through the table window’s Options > Appearance dialog box.
- subtype and domain options by checking “Display coded value domain and subtype descriptions”.
4. How do you delete unwanted rows?
You can do this by selecting the rows you want to show in the table. To show just the selected rows in the table frame, click the selected button on the table before adding it to the layout. Selections made afterward do not affect the data in the table frame. If the All button is selected when the table is added, the selection is ignored.

5. Is the table “live linked” to the data?
Any edits you make to the table will automatically be reflected in the table on the layout.
6. How do you delete unwanted fields such as ObjectID, etc…?
Change the field visibility from the Layer Properties > Fields Tab; these properties are respected for Table elements as well.
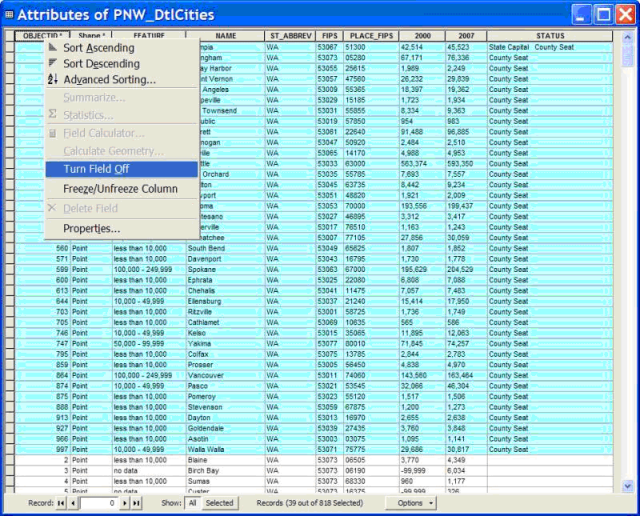
Optionally, you can also change the visibility in the table view. Right click the name of the field that you want to “hide” and select the option to “Turn Field Off”.
7. How do you sum one of the fields on the bottom line?
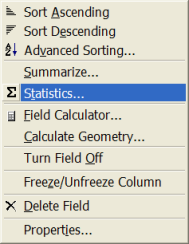
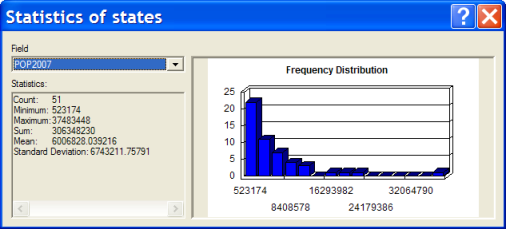
There is no out-of-the-box functionality to sum the values in a field to create a new value. However, you can easily sum the values in a numeric field by just right clicking on the attribute name and selecting the Statistics… option.
Another option is to use the Summary Statistics tool in ArcToolbox. This tool calculates statistics for field(s) in a table. You can add the output table to ArcMap and optionally add that table to the page layout.
You could group multiple tables together using the graphic tools so that they can be easily managed and positioned.
You could also use a custom report (in 9.3.1, under Tools > Reports > Create Report) and use one of the summary functions. To calculate summary statistics in a custom report:
- Click the Summary tab on the Report Properties dialog box.
- Click the Available Sections drop-down arrow and click the section where you want the statistics to appear.
- Check the box that corresponds to the statistic you want to display for each numeric field.
- Repeat steps 2 and 3 to display statistics in each available section.
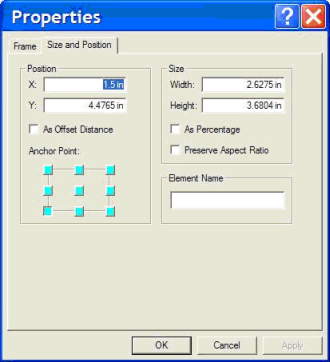
8. How do you set the size and position of the table in the layout?
There are some limited options for changing the appearance of the table once it has been added to the layout. Right click the table and select the Properties option. You can change the size and position of the table by typing in values in page units.
9. How do you set how much of the table is displayed in the layout?
The row and column that appear in the upper-left corner of the table window define what appears in the upper-left corner of the table on the layout. As you enlarge the table frame on the layout, you’ll see more rows and columns; however, the data displayed in the upper-left corner will not change. ArcMap will only display an entire row or column so a row or column will not appear until the table frame is large enough.
10. How do you delete the empty space to the right and bottom of the inserted table?
This needs to be manually adjusted. To manually adjust this, simply use the green handles to resize the extent of the table. Note that if you make the table size smaller than required for the rows or columns, the table will truncate, as described above.
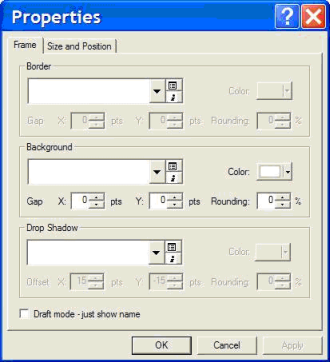
11. How do I change the frame and background of the table after I have added it to the layout?
Right click the table and select the Properties option. You can change the border and the background of the table, and you can also add a drop shadow.
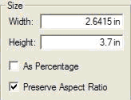
12. How do you drag a corner of the table to increase its overall size in the layout?
Turn on the option to “Preserve Aspect Ratio” from the Element Properties > Size and Position tab.
Thanks for Kent Marten, our Tables Product Engineer, for his help with the content of this blog!

Article Discussion: