
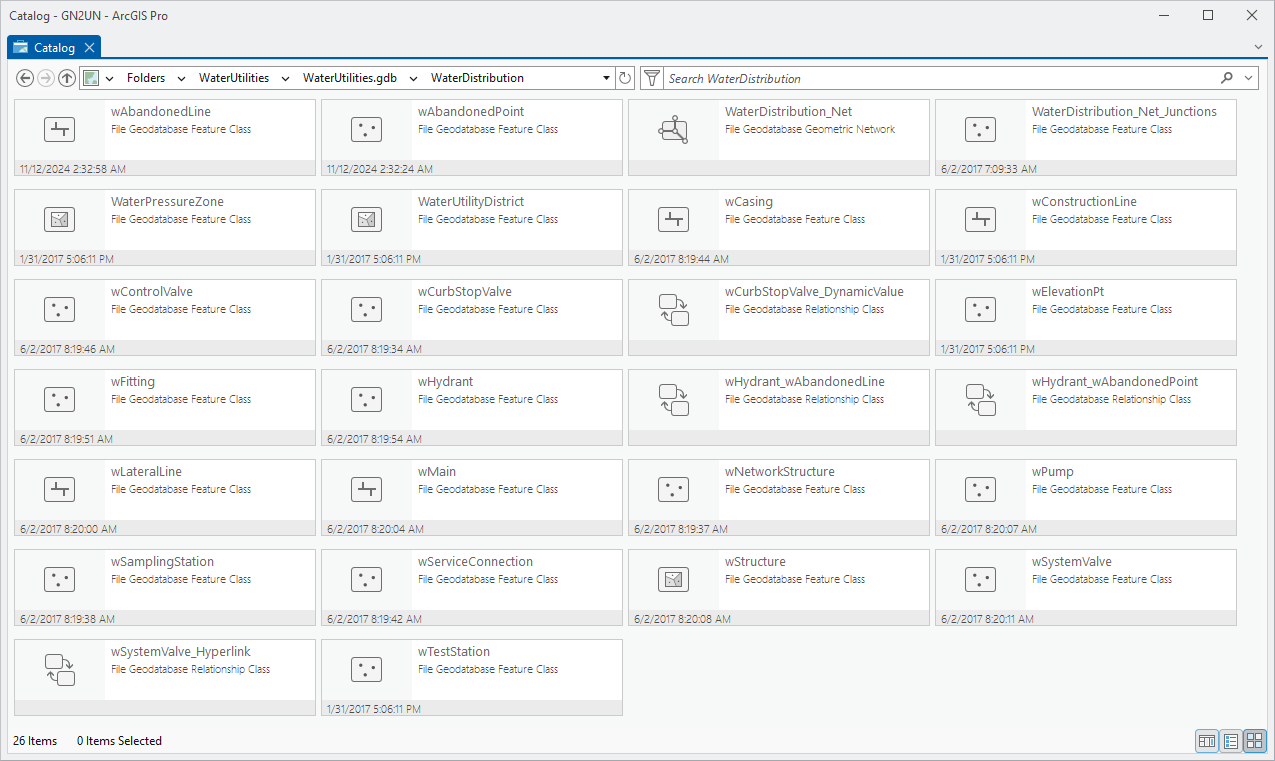
The Migrate to Utility Network tool provides many options for creating your own utility network. With so many options available, customers often wonder how the decisions they make will affect how the tool builds their utility network. In this article we will review the output of the tool, and how the decisions made during the configuration process influence the final model. The examples in this article are based on the water geometric network seen below.
Output
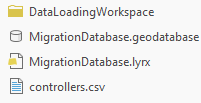
Once you’ve run the Migrate to Utility Network tool you will find the following items:
- Migration database – A new mobile geodatabase populated according to your mappings and settings
- Layer File – A layer file containing a default set of layers for the newly created schema
- Controllers CSV File – A CSV file containing any sources/sinks identified in your source data
- Data Loading Workspace – A data loading workspace that can be used to re-migrate your data. Learn more about this in the Migrating data to the utility network article.
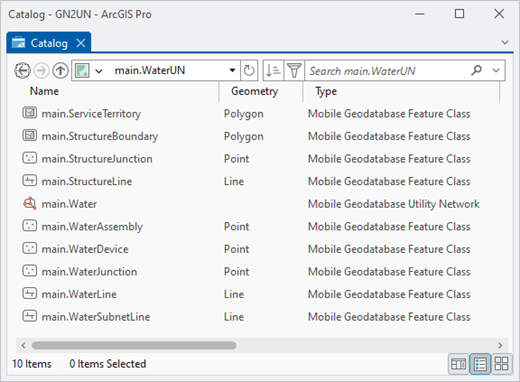
Let’s discuss each of these outputs in more detail. These files are created in a folder in the location you specified. The folder, geodatabase, and layer file will have the name you provided when you ran the tool. If you look inside the mobile geodatabase, you will see the feature dataset and utility network also have the name you specified. You will see structure layers, since these are required for each utility network, along with feature classes for each domain network you defined in the tool.
The CSV output from the tool can be used by the Import Subnetwork Controllers tool to recreate all the sources/sinks in your network. This step is something you will do once you’ve fixed all the errors in your data and are ready to begin running traces.
The last item output by the tool is a data loading workspace. This is used when you want to rerun the data migration using the same configuration, without having to recreate a new mobile geodatabase. You can find more details about how to use this workbench in the Migrating Data to the Utility Network article.
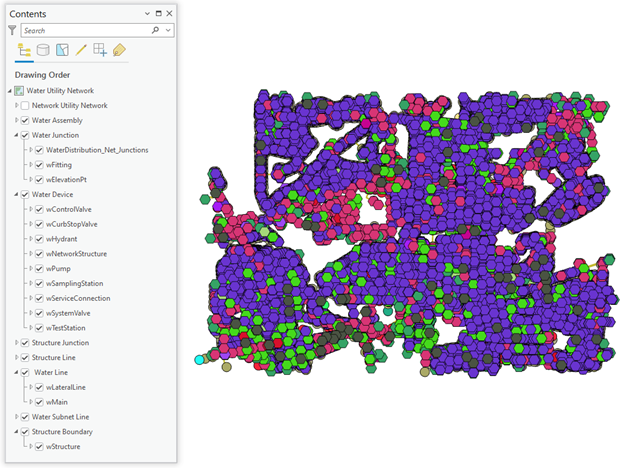
If you add the layer to a map, you will see that all the layers in your source data have become asset groups in their corresponding utility network classes. Any asset types you defined in your mappings will also appear under those layers.
Let’s look at the process that the tool uses to merge the schemas of different classes into a single class in the utility network.
Merging Schema
When the tool runs it merges source classes into the target classes you have defined. When this happens, the tool preserves the schema of each of the source classes. Let’s look at an example of how the fields from a pump class and valve class are merged into a water device class.

Each of these classes has its own set of unique fields and domains, but when the two are combined into a single class, all their fields and domains are combined. If we look at the resulting class, we can see that it contains a combination of required utility network fields, fields added by the migration tool, and fields from each class. The first fields on the class are always the fields required by the utility network and the migration process.
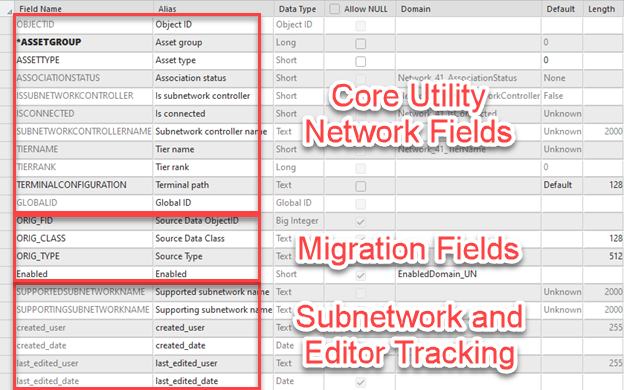
You can see at the end of the field list all the fields that were merged from all the classes. The field list starts with all the pump fields and ends with the fields unique to the system valve class.
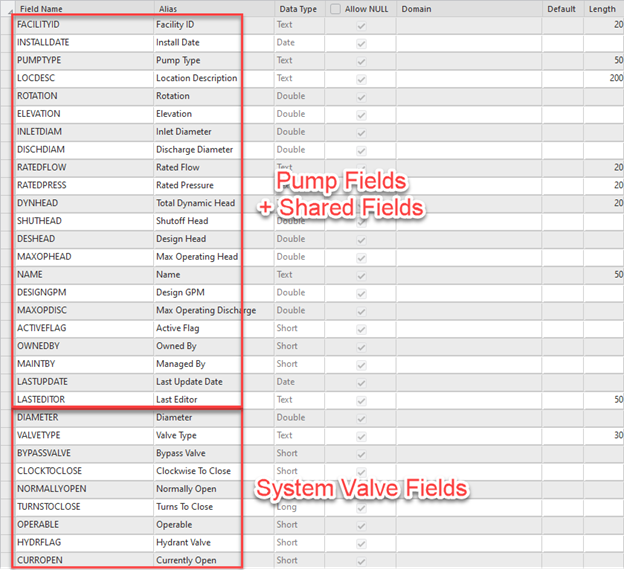
The way that fields are merged requires special attention. When two classes have a field with the same name and data type, the data for those classes will be consolidated into a single field. If two classes have a field with the same name, but different data types, the tool will add a second field with a suffix indicating it has a different data type. This approach allows the tool to ensure the data in all your fields is properly migrated to the utility network.
Domains
You may have noticed that there aren’t any domains assigned to these fields. That’s because the utility network requires subtypes. When a class has subtypes, all the domains and default values are configured for each subtype. If you’ve used subtypes before migrating to the utility network, you are already familiar with this behavior. You can confirm the new schema matches your original domains and default values using the Subtypes design view in ArcGIS Pro.
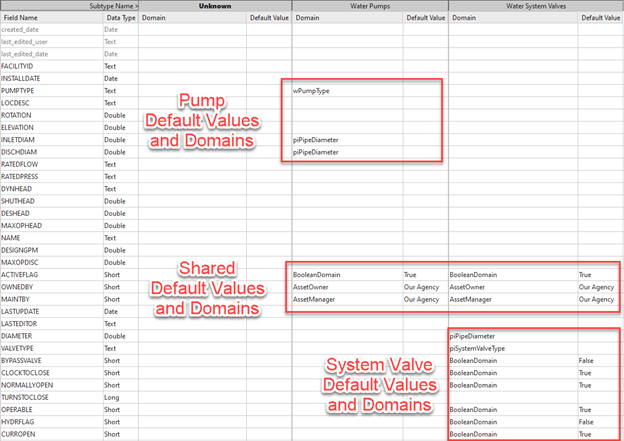
If your source data already had subtypes, then the tool will automatically merge the domains on those subtypes, if necessary. This raises another interesting question. If the source classes had subtypes, how does the utility network maintain that information going forward? The tool will automatically consolidate the default values and domains of your classes as best it can. If some information could not be consolidated, the tool will provide a warning during the migration process. Additionally, if you configured your subtype field to be the asset type field in the new model, the tool will use your existing subtype codes and descriptions as the asset types that asset group. We will give an overview of why asset types are important and how this process works in the next section.
What Are Asset Types?
What are asset types and why are they so important in the utility network? Every feature in a utility network is uniquely classified by a combination of its class, asset group, and asset type. You can see the asset types if you look at the network properties for a utility network.
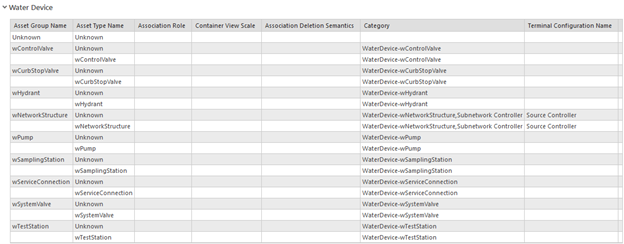
Looking at the asset types created by the tool we can see that the model built by the tool assigned a special terminal configuration to the asset group we defined as having controllers in our mappings. We can also see that each asset group has its own unique network category, this is convenient for when we want to configure reports or traces as these network categories allow us to easily identify features from different classes.
If you migrated any features to be structure boundaries, you will see they have been automatically configured to be containers. This allows you to configure your structure boundaries to contain other types of features. One example of this would be a pump station (structure boundary) being able to contain the pumps, valves, and pipes inside. These containment associations make it easier to understand the relationships between structures and equipment which are beneficial for both asset management and analysis purposes.

When configuring the behaviors of a utility network, these behaviors are almost always defined using asset types. The most practical example of this is the connectivity rules for the network. If you look at the connectivity rules in the network properties dialog you can see that asset types are used to define which features are allowed to be connected, attached, or contained to other features.
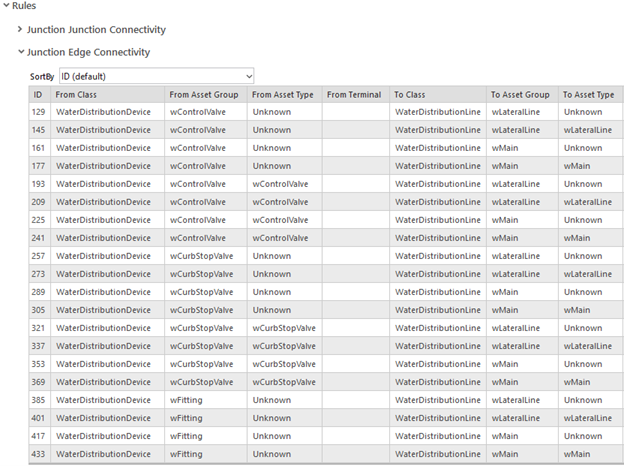
The utility network produced by the Migrate to Utility Network tool allows every asset type to connect to every other asset type, which is quite different from the Utility Network Foundations that have a conservative set of rules based on how equipment can be connected in the field.
You can learn more about how asset groups and asset types are used by reading the feature classification topic in the online Help archive. You can also learn how to configure different behaviors in a utility network using asset types by reading the Configure a utility network topic in the online Help archive.
Configuring Asset Types
When a class is migrated into the utility network, how do you control how asset types are created? If you have subtypes, the best way to configure asset types is to select its subtype field as the asset type field. This makes it easier to configure connectivity rules, and other pieces of the utility network, to act upon each of these asset types with more specific behaviors.
But what do you do if you want asset types, but don’t have a subtype field? Any field with a coded value domain assigned to it can be used to populate the asset type field. If you don’t have any fields you want to use to define asset types for an asset group, you can always leave the asset type field mapping blank and have all the asset group belong to a single asset type.
Let’s look at an example of this in a water model that doesn’t use types. If we migrate our device classes without specifying an asset type field, each asset group gets a single asset type with the same name as the asset group.
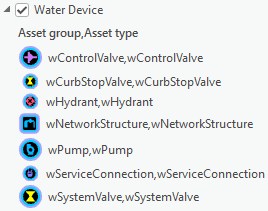
This means that all the features will behave the same in the network and will have the same configuration. While this is fine for some classes, other classes may have a field that you can use to better differentiate the types of features in the class. If we populate the asset type field with the “Valve Type” field on Control Valves and the “Structure Type” field on Network Structures, we will instead end up with an output that looks like this:
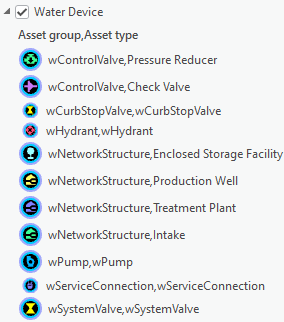
Why is this important? Because these two classes contain very different types of equipment that affect the way we manage our network we need to be able to differentiate them. Pressure-reducing valves are used to manage pressure zones (a form of subnetwork), while check valves are used to prevent water from backflowing. Each of the network structures serves its own unique role within the network, and being able to differentiate them allows us to better capture those behaviors.
So how do you know when to configure a field as an asset type field? If a field is used to define the subtypes of a class, or if you would like to configure snapping/connectivity rules based on the contents of a field, then you should consider using it as the asset type field for the mapping.
Asset types play an important role in configuring your utility network, because they allow the utility network to differentiate behaviors between different features. When you are configuring different rules and behaviors in the utility network, you will see that this configuration often refers to a specific asset type within the network. This is how the system can identify that certain pieces of equipment are allowed to act as network sources, while others can act as barriers. For more details on the different types of configurations you can apply to a utility network, and which ones rely on the asset type, read the Configure a utility network page in the ArcGIS Help Online.
Subnetwork Definition
The last configuration we want to examine is one of the options during mapping to specify that the mapping for that class is a controller. Selecting this option will apply configurations to the asset types in that class so they can act as subnetwork controllers, the devices that act as the sources/sinks in the network. Additionally, if the features in these classes have an ancillary role value of source or sink, the tool will create a CSV file that you can import to easily enable them as subnetwork controllers in your network. Let’s walk through the process below.
In the mappings section of the form, the Network Structure class was identified as being a class that acts as a controller.

Any classes identified as containing controllers during the mapping process will be configured so their features can be Subnetwork Controllers in the utility network. This includes assigning them the Subnetwork Controller network category, setting an appropriate Terminal Configuration, and adding a Tier to the utility network that allows them to act as a subnetwork controller. The tier created by the tool has the following properties:
- Tier name – Based on the domain network name
- Tier rank – 1
- Supports disjoint networks – True
- Update subnetwork policy – Do not manage status, do not update structure/domain contains, do not use eventing
- Valid subnetwork controllers – All the classes configured as subnetwork controllers
- Valid devices – All device classes
- Valid junctions – All junction classes
- Valid lines – All line classes
- Aggregated line – None
- Trace configuration – Do not include structures, containers, or content. Disabled devices are barriers.
- Subnetwork diagram – None
These default values allow for a simple configuration that allows everything in the network to belong to a single tier. This generic configuration is a good start for a generic network, but there are certain changes that each industry typically makes to these configurations to support their workflows. For example, the electric industry typically does not allow disjoint networks and manages the is dirty field. Changing these properties is a common administrative task performed by running the Set Subnetwork Definition tool.
Creating Subnetworks
In addition to creating an initial subnetwork definition, the tool can also create an initial set of subnetwork controllers for you if you meet the following criteria:
- You must have features with an ancillary role value of source/sink and the class must participate in a Geometric Network
- You must map these classes as subnetwork controllers
Let’s look at an example. Create a mapping for a water domain network. These networks use sources and are typically hierarchical.

We then add a mapping for the Network Structure class and check the option saying that this class contains controllers.

When the tool runs it checks to see if the class belongs to a geometric network, and if it does it checks to see if any features in that class have an ancillary role of source or sink. Below we can see that this class has four records with an ancillary role of Source.

If one or more sources/sinks are discovered, this has an important impact on the output of the tool.
- Only those asset types will be allowed to be subnetwork controllers.
- The tool will populate a CSV file that can be imported to turn those features into subnetwork controllers
The controller CSV file will be in the same directory as the output geodatabase. This file contains all the information required to enable those features as subnetwork controllers for a single system-wide subnetwork. You can see the contents of the file below:

You should review and update this file before importing it into your network using the Import Subnetwork Controllers field. Below are the columns you will want to pay special attention to
- Subnetwork Controller Name – The tool uses the feature’s GlobalID by default. If you have another globally unique identifier you want to use to identify the controller you can populate it here.
- Subnetwork Name – If you have multiple systems in your network, you will want to adjust the value for each controller to match your desired system names. For electric customers, each subnetwork controller typically controls a single subnetwork that represents a feeder.
Once you’ve made the desired changes, you can then import the file using the Import Subnetwork Controllers tool.
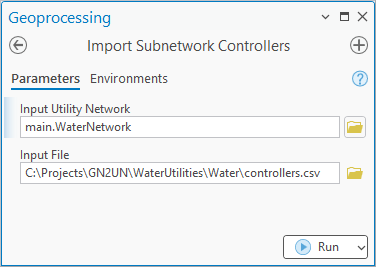
Note: If you decide to change your subnetworks after importing them, you must manually delete them. Make sure you carefully review and update the CSV file before you import it.
Using Subnetworks
Before you can do any tracing or analysis with your subnetworks, you will need to resolve all your topology errors. You may need to perform some additional configuration on your network if you weren’t using your geometric network for tracing, used custom trace weights, or used third-party extensions to perform tracing.
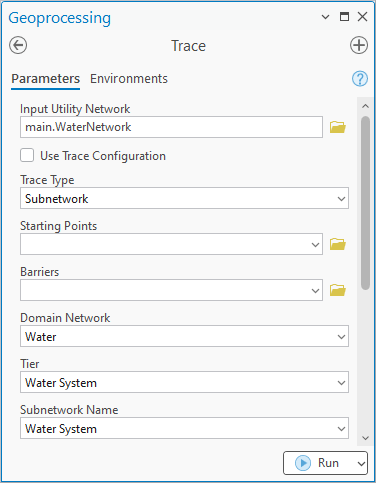
However, once you’ve cleaned up your data you will be able to test your subnetwork(s) by using the Trace tool as shown below.
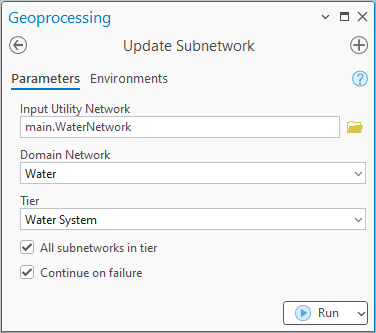
You can use the Update Subnetwork tool to create a subnetwork line for each subnetwork and populate a subnetwork name field on each feature. With additional configuration, you can make your subnetworks calculate summary statistics, like the total length of linear assets or the number of service connections.
You can learn more about subnetworks in the Analysis and Tracing with ArcGIS Utility Network learning series.
Non-network data
In addition to migrating your network data into utility network features, the tool also allows you to migrate standalone tables, related data, and attachments. This process is relatively straightforward, with a few limitations. The first limitation is that the tool can only migrate GlobalID based relationships. This is because relationships based on ObjectIDs or other fields are not guaranteed to be preserved during data migration. The second restriction is that the tool can only migrate 1:1 or 1:M relationships, any M:N relationships cannot be migrated at this time. The last restriction is that any classes that make use of custom class extensions cannot be migrated, as the tool will be unable to read the classes.
If your data meets all those restrictions, then the desired objects will be copied to the target database and into a dataset with the same name as the origin, and any relationship classes between the copied features will be recreated in the target database. This includes standalone tables and feature classes as well as annotation and dimensioning features.
The related classes that are copied over will not be consolidated, even if the items they were related to have been consolidated. If you have relationship classes for several different device classes in your source database your target database will have the exact same number of attachment classes and relationships in the target database, even though they are all related to a single device class. However, because a class can only have a single attachments class all attachments will be consolidated to a single attachments class.
Conclusion
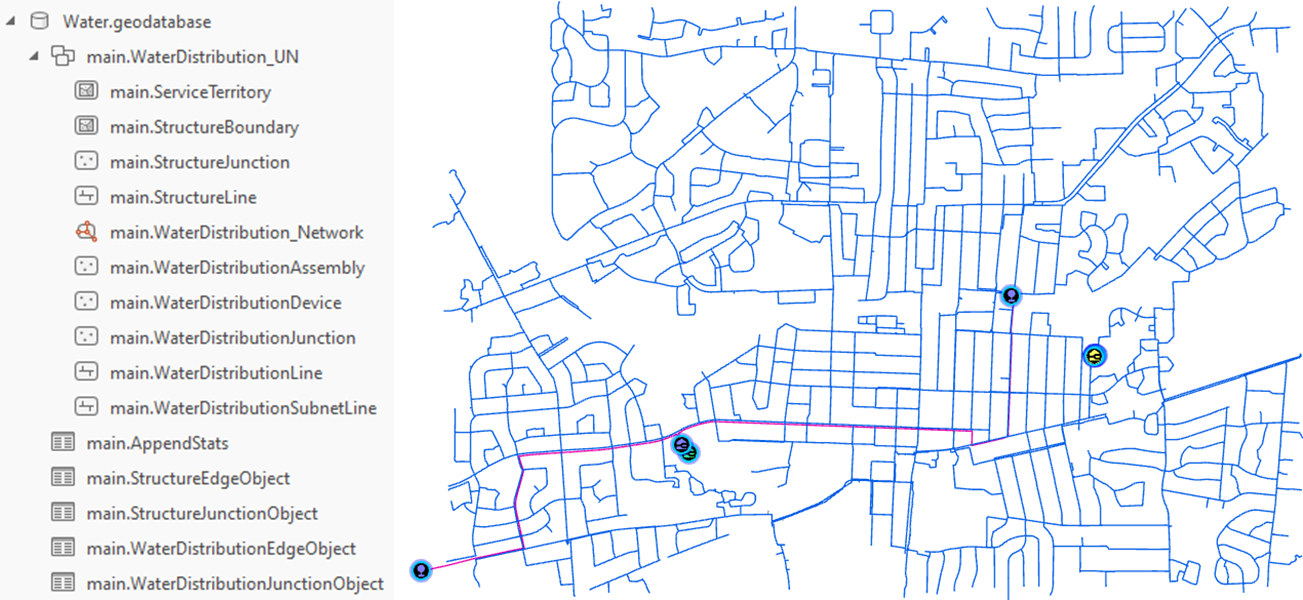
Now that you’ve seen how the Migrate to Utility Network tool creates and configures a utility network based on your data, you are better equipped to understand how you can use it to create your own utility network model. This tool makes it easy for customers of all sizes to experiment with the utility network using their data, learn about the capabilities of the utility network, and make informed decisions about whether to build their own utility network or adopt a Utility Network Foundation. The next article in this series discusses the matter of data cleanup. The migration toolset also includes tools to assist in identifying and resolving critical data quality issues. Streamlining and improving this error resolution process is another important area where we’ve made improvements to ensure that data quality issues aren’t preventing customers from realizing the benefits of their utility network implementation.
The conversation continues over on the Esri Community site! You can not only ask questions there, but you can download these tools and find additional resources covering topics like configuration and building your own data migration for the utility network.



Commenting is no longer enabled for this article