At the Esri User Conference in San Diego last year, a small team of Esri engineers from the Python and Server teams huddled together with Scott Morehouse, who is one of the original designers of geographic information systems, to conceive what a modern Python API for the Web GIS would look like. Today, after eighteen months of endless design discussions, debates, development and demos, we are excited to announce the release of the ArcGIS Python API.
The project (codename Geosaurus) was initiated with this scope and vision:
Geosaurus is a project to design and implement a pythonic API for a GIS. A GIS consists of:
– An information model
– Visualization functionality
– Editing functionality
– Information management functionality
– Analysis functionality
A pythonic API is one which corresponds to Python best practice style in its design and implementation (e.g. PEP 8) and which leverages standard Python types, classes, and packages.
The Geosaurus API has Python modules, classes, functions, and types for managing and working with the elements of a GIS information model. This includes both data and visualization elements (i.e. maps, scenes, layers as well as datasets).
The API design of Geosaurus will be generic – not tied to specific ArcGIS jargon or implementation patterns. Although a “pure Python” implementation is possible for the API, it is intended to be implemented by leveraging Esri native code libraries.
In Python, a package consists of modules containing classes and functions. A module is an installable component, with all the Python and native code necessary for execution. Functions, classes, and class methods are parameterized using Python types. These types include built-in primitives (e.g. string, number) and structures (list, dictionary), as well as object class instances. Where possible, Geosaurus will employ “native” Python types (e.g. primitives, lists, dictionaries, and standard library objects) rather than introducing new types.
So, what is the ArcGIS Python API?
It is the Python API to your Web GIS, which could be online or on-premises.
It’s powerful, modern and easy to use.
What do I mean by that?
It’s powerful as it harnesses the full power and content of your Web GIS, including the ability to create, use and manage GIS resources such as users, groups and content including web maps and web layers, and provides access to the rich analytical capability of the ArcGIS platform.
The API is modern as it’s a new library built for Python 3 and integrates well with popular Python libraries such as Pandas, Numpy and the SciPy stack. It works especially well with the Jupyter Notebook and is distributed using Conda – a modern package and environment management system for Python.
And it’s easy to use. It uses standard Python idioms and types and avoids introducing a complex type system or API. We’ve worked very hard on keeping the API ‘short and sweet’.
It’s implemented on top of the REST APIs of the Web GIS platform – that’s just an implementation detail, so you know where it sits in an Architecture diagram. However, the API is a pythonic representation of a GIS and you don’t need to know anything about REST, such as how GET and POST work, how to obtain access tokens, and so on to use it.
ArcGIS Online is built into the API and everyone can use the GIS() to work with the rich collection of public-access maps, layers and tools published by Esri and authoritative sources from around the world, as well as use essential GIS and mapping functionality.
GIS(public account) lets you use the public content and tools to create, store, and manage maps, apps, and data, and share them with others using this API.
With GIS(org account), you have access to the subscriber content from the Living Atlas as well as the rich collection of spatial analysis tools and can publish, share and use content throughout your organization, across a community, and openly on the Web. The API has great support for managing and administering your ArcGIS Online Organization or ArcGIS Enterprise – users, groups and content included.
GIS(enterprise account) enables you to keep your GIS under your complete control, online or on-premises. You can use the latest geoanalytics and raster analysis tools with this API and leverage distributed analysis of large datasets to gain insights from big data or create information products. We can’t wait to hear about the amazing things you will do by combining Python and the Scipy stack with realtime GIS, imagery and geoprocessing!
A free developer account lets you get started quickly with free credits, features like geocoding, routing and geoenrichment and premium content like demographic and traffic maps from Esri.
Who is this API for and what can you do with it?
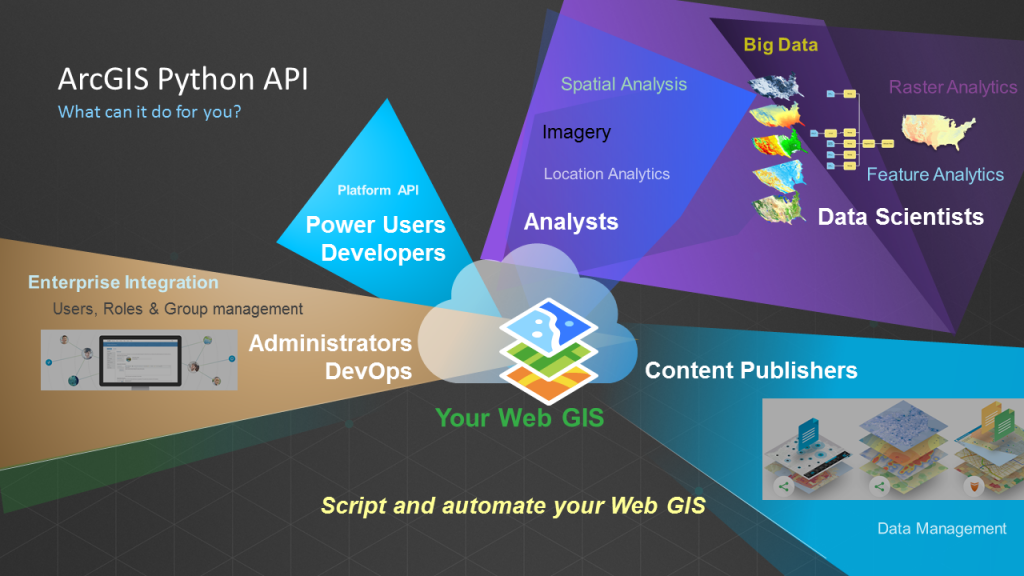
If you’re a Web GIS Administrator or a DevOps person, you can automate most of your repetitive tasks and use scripts instead of using the UI and clicking your way through. You can schedule these scripts to run at periodic intervals and do things like standing up Portals or your online org, creating users, assigning roles, creating groups and set access restrictions and so on.
If you’re a content publisher, you can take care of repeated content creation and content validation workflows using scripts. You can clean up and fix stale items in your GIS, script and automate the creation of web maps and web layers, update tiles and features, fix broken links in web maps and layers and update them – doing things that may be tedious or not apparent through the UI.
If you’re an analyst, data scientist or academic user, you can use all of the analytical capabilities of the ArcGIS platform including spatial analysis as well as the recently introduced geoanalytics and raster analytics tools that provide distributed analysis of large datasets.
You can also use the API through the Jupyter notebook to record your workflows and share how you arrived at your conclusions. You can combine this API with the rich set of libraries in Python, especially in the machine learning and analysis space and do all sorts of amazing things.
And finally, an important category of users this API is targeted towards is that of a Web GIS power user.
If you know a lot about Web GIS, use it everyday, and want to become more efficient by automating your workflows, this could be the first ArcGIS API for you. Python is a great language for people who want to start programming, and is very readable…
… and conversely, this API is geared towards a Python programmer who doesn’t know a lot about GIS but wants to add geographic analysis to his or her workflows. It provides a gentle introduction to GIS for the Python programmer as it models a generic GIS system through its simple, intuitive design.
That’s quite a mouthful. It’s probably best seen through a demo. So, here is the ArcGIS Python API explained in a quick 5 minute video:
A Pythonic API for GIS
The ArcGIS Python API is Pythonic representation of a GIS. We designed the API to be modular – the modules make it easy to learn and use the API. Each module has a handful of types and functions that are focused towards one aspect of the GIS.
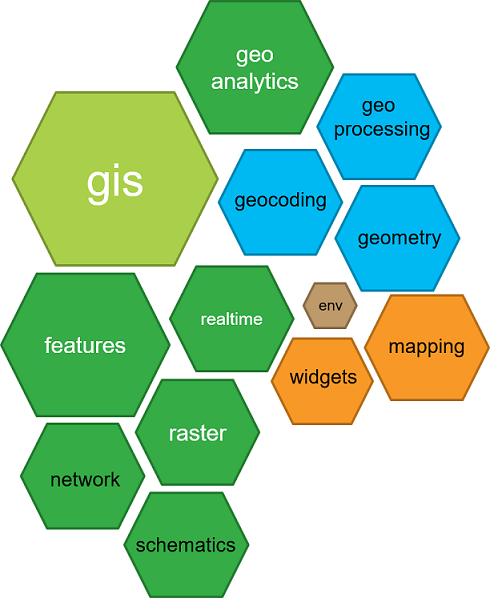
The gis module is the most important and provides the entry point into the GIS. It lets you manage users, groups and content in the GIS. GIS admins spend a lot of time on this module.
The modules in green are used to access the various spatial capabilities or geographic datasets in the GIS. These module includes a family of geoprocessing functions, types and other helper objects for working with spatial data of a particular type. Some examples are these modules:
- The features module is used for working with feature data, feature layers and collections of feature layers in the GIS. It also contains the spatial analysis geoprocessing tools which operate against feature data.
- The raster module containing classes and raster analysis geoprocessing tools for working with raster data and imagery layers.
- The geoanalytics module provides types and geoprocessing tools for distributed analysis of large feature and tabular datasets.
The modules in blue provide additional functionality for your workflows. They include the geocoding module which is for finding places and the geoprocessing module that makes it easy to import third party geoprocessing tools and work with them.
The modules in orange allow you to visualize GIS data and analysis. They include the MapView Jupyter notebook widget for visualizing maps and layers and classes and functions for working with web maps and web layers.
Where can I get it?
All the information you need about the API can be found in the product website at http://developers.arcgis.com/python. From here, you can find links that take you to the API guide, sample notebooks, API reference, a helpful forum to ask and answer questions and quick links that tell you how to install the API and get started quickly.
The samples are organized by the different user profiles that I mentioned earlier. There are samples for power users and developers, administrators, analysts and data scientists and for content publishers.
The samples and guides are in the form of Jupyter Notebooks that you can download from the GitHub repository, and run locally on your system. The samples also serve as starter templates on which you could base your scripts upon.
Reflection and the Road Ahead
While there’s still a lot of ground to cover and we have a busy year planned for this exciting, new API, Scott has this to say about reaching this important milestone of the first public release of this API:
Rohit and his development team has been remarkably successful in carrying out this vision and in developing a great Python experience for working with maps and geographic information.
I’m looking forward to the capabilities of the ArcGIS Python API to continue to grow, with functionality expressed clearly in a way that leverages the Python scientific programming environment.
In this festive season, when families huddle together to celebrate Christmas and bring in the new year and programmers recharge their batteries and sharpen their knives by looking at what the latest developments are in the technology space, we’re excited to release this powerful, modern and easy to use API, and hope you’ll find it useful!

Article Discussion: