Infographics help visualize key demographic characteristics for areas of interest with interactive charts, tables, maps, and images. Additionally, infographics can help you answer location-based questions using a data driven approach while showcasing your findings with stunning visualizations.
ArcGIS Business Analyst apps such as Pro or Web allow you to run several ready-to-use infographics. However, this blog focuses on the REST API of the GeoEnrichment Service. For example, walk you through how to choose an infographic, define your area of interest and create one with a request directly to the server.

Where can I find a list of available infographics?
To find a list of the standard infographics for a specific country or region, use the infographics discovery method. For instance, here is an example of how to find the infographics for the U.S.
URL Request
1. First, return a list of the standard infographics for the current year of Esri’s US 2025 data.
https://geoenrich.arcgis.com/arcgis/rest/services/World/geoenrichmentserver/Geoenrichment/Infographics/Standard/US/esri2025?f=json
2. Alternatively, return a list of the standard infographics for the previous year of Esri’s US 2024 data.
https://geoenrich.arcgis.com/arcgis/rest/services/World/geoenrichmentserver/Geoenrichment/Infographics/Standard/US/esri2024?f=json
The above requests will return JSON arrays of infographics and their associated IDs referred to as report IDs for the US. In addition, to find the infographics for a different country or region, simply replace US in the URL request with a different 2-digit code. A list of 2-digit codes can be found on the GeoEnrichment coverage page.
Report IDs
The report ID is what you’ll pass to the GeoEnrichment service to specify which infographic to return. For example, here’s a list of all the standard infographic report IDs for the U.S. gleaned from the URL request above for the current year of Esri’s 2025 data. Click on each link below to see a sample image.
How do I run an infographic directly from the GeoEnrichment REST API?
Now that we’ve discovered the available infographics and have picked one to run, let’s send a request to the GeoEnrichment service using the Create Report operation. This operation downloads an infographic to your device as either a PDF, dynamic HTML or Excel file.
Key parameters
f
The format in which the file information is transferred. The only supported value is bin for binary.
token
The access token used to access service operations. The value can be an API Key or OAuth 2.0 token. For more information on creating API keys, click here.
format
The type of file to be returned. Supported values are pdf, html or xml. Dynamic html output can be embedded in a website and has interactive panels which provide additional information.
report
The ID of the infographic to run.
demographic-summarykey-facts
studyAreas
An array of input xy or address locations, polygons or administrative boundaries. For point locations, the default area is a 1-mile buffer.
[{"geometry":{"x": -122.435, "y": 37.785}}][{"address":{"text":"380 New York St. Redlands, CA 92373"}}][{"sourceCountry":"US","layer":"US.ZIP5","ids":["92373"]}]
studyAreasOptions
An array of values to control how input points are buffered. Supported area types include ring buffers and network service areas such as drive times and walk times (routing services must be enabled on the API key for service areas). Multiple buffer radii can be requested. The unit of measurement requested can be miles or kilometers and in the case of service areas, minutes and hours are also supported.
{"areaType":"RingBuffer","bufferUnits":"Miles","bufferRadii":[1,3,5]}{'areaType': 'NetworkServiceArea', 'bufferUnits': 'Minutes', 'bufferRadii': [5,10,15],'travel_mode': 'Driving'}
URL Request
https://geoenrich.arcgis.com/arcgis/rest/services/World/geoenrichmentserver/Geoenrichment/createreport?
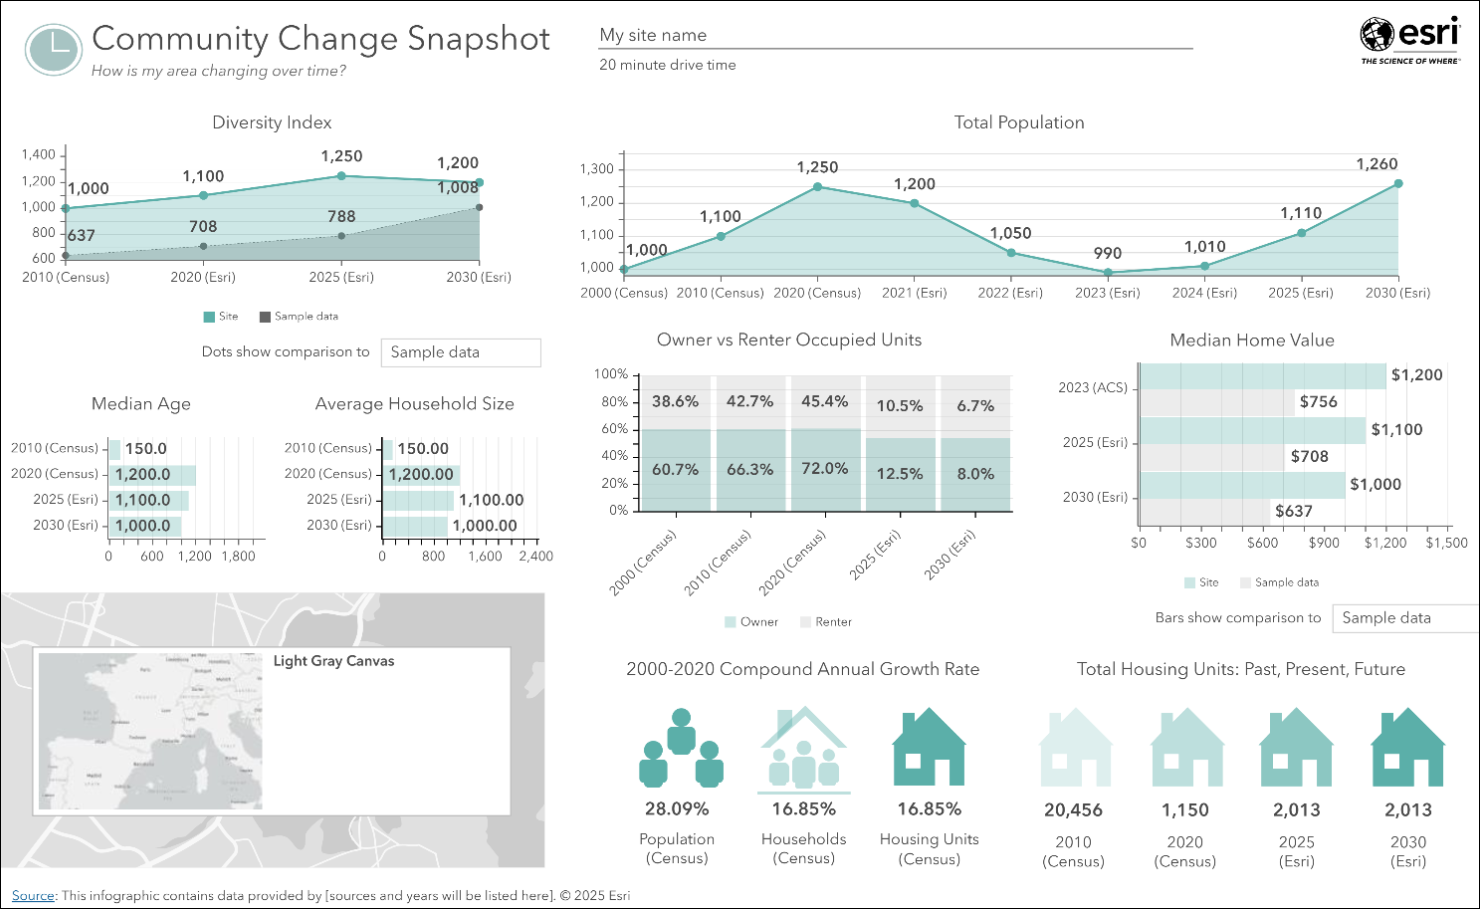
studyAreas=[{'geometry':{'x': -117.1956, 'y': 34.0572}}]format=PDFreport=community-change-snapshotf=bintoken=<ACCESS_TOKEN>
Output PDF
How do I build my own custom infographics and use my own data?
In addition, you can build your own custom infographics with well-defined workflows in ArcGIS Business Analyst. For example, the custom data setup and build infographics workflows in the BA web application are designed specifically for this. After that, when you have a custom report template built in Business Analyst, it will exist as an item in your organization’s content. For example, the item ID of the custom report can be passed in the report parameter as shown in the example below.
studyAreas=[{'geometry':{'x': -117.1956, 'y': 34.0572}}]format=PDFreport={"token":"<ACCESS_TOKEN>","url":"https://www.arcgis.com","itemid":"<itemid>"}f=bintoken=<ACCESS_TOKEN>
Article Discussion: