You may have heard that ArcGIS 10 is “time-aware”. This simply means that you can designate one or more fields in your data as containing date/time values, and then ArcGIS can play back the temporal progression of that data using a “time slider” bar. There are time sliders built into ArcMap and ArcGIS Online, but you can also add them to web apps that you build with JavaScript, Flex, or Silverlight. Showing the temporal progression of data like this was technically possible before ArcGIS 10, but it required a lot more coding.
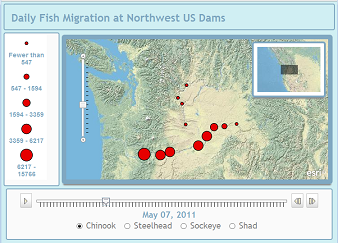
To demonstrate one way that time-aware GIS data can be put in a web app, I created this JavaScript map of fish migration up the Columbia and Snake Rivers earlier this year. The dams along the river have fish ladders, where each fish is counted as it swims up the river. Visualizing the daily fish counts over time is an excellent way to see migration patterns. Take a few seconds to give the app a try.
In this post I’ll explain a little about how I built this app and where you can get the code.
Getting the data and making it time-aware
The raw fish count data came from the Fish Passage Center website, www.fpc.org. Here I was able to download comma-separated value (CSV) files showing fish counts for each dam in 2011. These CSV files are similar to what you might be able to export from Microsoft Excel. To make this data work on a map, I also had to have the dam locations, so I created a point feature class and heads-up digitized each dam.
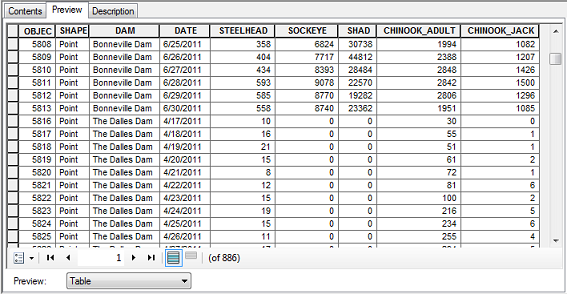
Sometimes time-aware datasets are structured differently from traditional datasets you might use for a paper map. What I really needed for this web app was not one record for each dam, but rather, one record for each dam for each day. Thus, what looks like a simple dataset with only a handful of points, really contains over 800 records.
With a little bit of Python, I was able to read the fish counts out of the CSV files and write them as attributes for each dam for each day. Here’s a portion of the final table:
In order to make this type of data time-aware in ArcGIS, you have to add it to ArcMap. Then open the Layer Properties and click the Time tab. Here is where you tell ArcGIS about your dataset and how its time fields should be interpreted.
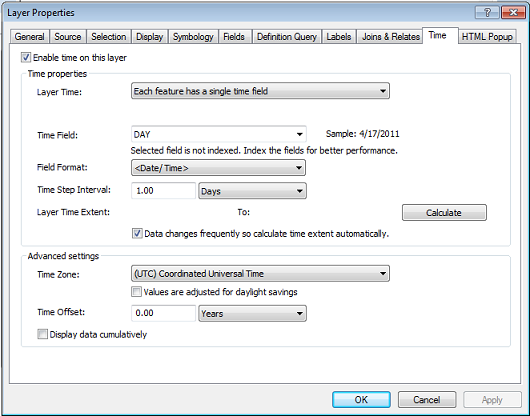
One of the first settings you need to choose is whether the layer has a single time field, or both start and end time fields. Some phenomena, like fish counts, are taken at one point in time and just have one field. Other things might have a field recording both the start and end time of an event, such as a wildfire that begins on June 9 and ends on June 13.
You can also indicate which field holds the time values, as well as the time extent and intervals that should be displayed in the time slider.
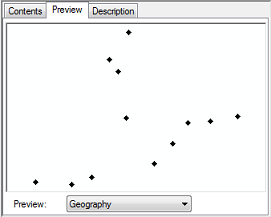
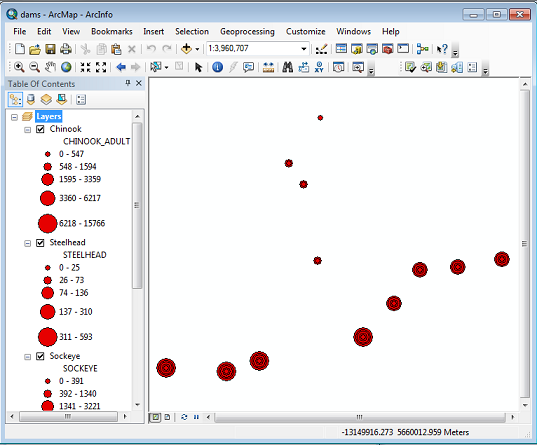
In my particular map, I wanted the same service to expose data about four fish types. So I made four copies of the layer, symbolized them with proportional symbols, and made them all time aware. Below is what the final map looked like. (It’s okay that all layers are turned on and overlap, because my app only requests one layer at a time from the map service.)
Exposing time-aware layers through a web service
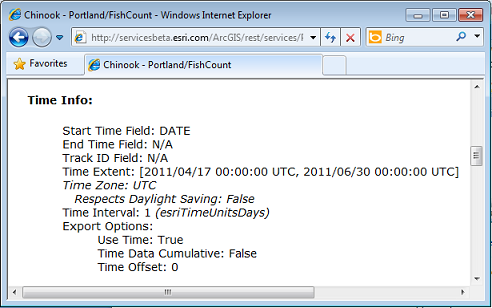
At this point I was ready to publish the map as a service. I saved a map service definition (MSD) file (yes, these support time-aware layers) and published it to ArcGIS Server in the usual way. All of the time information saved in the map is accessible through the map service. You can verify this by looking at a layer in the Services Directory:
One easy way to view a time-aware map service is to add it to the ArcGIS.com map viewer (go to www.ArcGIS.com and click Map to get to this viewer). The viewer recognizes any time-aware services you add and automatically gives you a time slider. In my case, I wanted to go a little further and make my own web app with a time slider. I chose the ArcGIS API for JavaScript because I had a bit of previous experience with it, and my adjacent co-workers happen to know this API very well. (I can’t deny asking for the occasional hint!)
Building a time-aware web map with JavaScript
When you’re starting out with the ArcGIS web APIs, a good strategy is to find some of the online samples that do the things you want to do, combine them into an app, and then modify the result to fit your requirements. I decided I wanted to use elements from these two samples:
- Overview map sample from the Layouts book. You’ll see this is where I got the overview map, color scheme, styling, and partitioning of the window.
- Layer Definition sample from the Time book. This is where I got the time slider and the legend.
The fish counts update very quickly because the app uses client-side graphics to display them. In other words, the browser makes a request to the map service saying essentially: “Give me all the point vertices for the dams from April 17 – June 30, and their attributes. I’ll do the work of drawing them.” After the server sends the response, the browser can draw the points and their symbols without ever having to go back to the server for more information. Because I’m dealing with fewer than 1000 records, I don’t have to worry about hitting the map service’s default limit for how many features it will return, but at the same time I am not requesting an unreasonable number of points for the browser to display.
The key to displaying the graphics this easily is to use the FeatureLayer class. Here’s where I create it in my code:
var fishLayer = new esri.layers.FeatureLayer(initialFishLayerUrl, {
  mode: esri.layers.FeatureLayer.MODE_SNAPSHOT,
  outFields: ["*"]
});
When you connect a FeatureLayer to a TimeSlider, the time slider does all the work for you of requesting and displaying the appropriate features for the currently displayed time slice.
The time slider is a widget included with the ArcGIS API for JavaScript. To use it, I had to put the following at the top of my code:
dojo.require("esri.dijit.TimeSlider");
Then, I had to create the time slider and set some properties on it, such as the thumb moving rate (how fast the slider plays) and whether the time slider should replay itself when it gets to the end (accomplished with the setLoop method).
// Create and configure the time slider
var timeSlider = new esri.dijit.TimeSlider({
}, dojo.byId("timeSliderDiv"));
map.setTimeSlider(timeSlider);
timeSlider.setThumbCount(1);
var layerTimeExtent = results[0].layer.timeInfo.timeExtent;
timeSlider.createTimeStopsByTimeInterval(layerTimeExtent, 1, 'esriTimeUnitsDays');
timeSlider.setThumbMovingRate(350);
timeSlider.singleThumbAsTimeInstant(true);
timeSlider.setLoop(false);
timeSlider.startup();
If you use the time slider in the ArcGIS API s for Flex or Silverlight, you’ll see similar properties.
You can handle events on the time slider to control what happens when the “thumb” on the slider moves. The drawing of the fish counts is handled automatically, but I did add some code to change the date label that appears directly below the slider.
// Report the date whenever the time slider moves
dojo.connect(timeSlider, "onTimeExtentChange", function(timeExtent){
  map.infoWindow.hide();
  dojo.byId("timeSliderLabel").innerHTML = dojo.string.substitute("<b>${startTime}, 2011</b>", timeExtent, function(val) {

      return dojo.date.locale.format(dojo.date.add(val, "hour", hourOffset), {
      selector: 'date',
      datePattern: 'MMM dd' // http://www.unicode.org/reports/tr35/tr35-4.html#Date_Format_Patterns
    });
  });
});
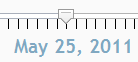
The above code results in a label that changes as the slider moves:
Conclusion and download link
This post has shown how you can start with raw tabular data and ultimately display it in a time-aware web application. The coding part is optional and can be eliminated if you want to use the time slider in ArcMap or in ArcGIS Online. However, because many of you may have to write similar types of web apps, I’ve made the complete application and a readme file available for download at http://esriurl.com/fish.
Contributed by Sterling Quinn of the ArcGIS Server software development team
Commenting is not enabled for this article.