Walk-time maps—the walking version of drive-time area maps—show where and how far pedestrians can travel in a certain amount of time. Learn how to make a walk-time map with ArcGIS Online.
Where can we walk in 20 minutes?
My four-year-old niece, Maria, and I considered this question. Maria had a new scooter and wanted to try it out while I walked with her. My sister thought Maria might last 40 minutes round trip. But unless I wanted to carry Maria home—I did not—we should consider a few shorter walks as well.
How did Maria and I decide where to go? We made a walk-time map.
Walk-time maps—the walking version of drive-time area maps—are based on a predefined walking speed (usually 5 kilometers per hour) and paths and roads that allow pedestrian traffic.
Using ArcGIS Online, we made a walk-time map.
Find the start location on a map
1. Sign in to ArcGIS Online with your ArcGIS account and click Map.

To create walk-time areas, you’ll need privileges to create content, publish hosted feature layers, and perform spatial and network analysis. If you don’t have these privileges, contact your administrator or get a free ArcGIS trial.
2. On the Settings (light) toolbar, click Search, type your start address in the search bar that appears, and choose from the suggested addresses.
The map displays a pop-up with your search result.

Add the location to a sketch layer
1. At the bottom of the search result pop-up, click Add to new sketch.

A new sketch layer is added to the map.
A layer is a logical collection of geographic data—for example roads, rivers, or boundaries such as ZIP codes. When you create a map, you can combine many layers. For this map, the new layer that you created contains one data point: your address.
Sketch as a name is too general, especially to my four-year-old assistant, so we renamed it.
2. From the Contents (dark) toolbar, click Layers, click Rename, and rename Sketch to something more specific.

We renamed our layer to “My house”. ‘Obviously’, declared Maria.
Create walk-time areas
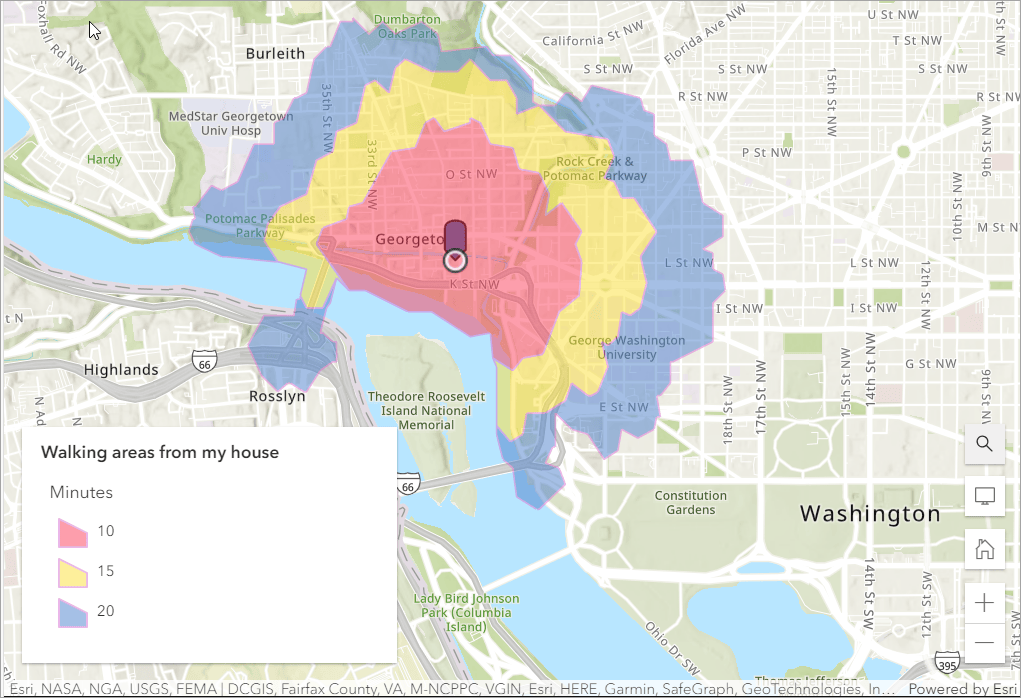
Maria and I decided we should create three walking areas: 10-minutes, 15-minutes, and 20-minutes.
1. From the Settings toolbar, click Analysis, click Tools, type walk time in the search bar, and click Generate Travel Areas.

2. For Input layer, click Layer and choose My house. For Travel Mode, choose Walking Time.
3. For Cutoffs, type 10 and click Add. Repeat for 15 and 20.
4. For Cutoff units, choose Minutes.
5. For Travel direction, Departure time, and Overlap policy, keep the defaults.

6. Type a unique name for your output layer and click Run.

When the analysis is done, your walk areas appear on the map and a new layer appears in the Layers list.
We couldn’t see all the areas from the current view so we zoomed out a bit.
7. From the Contents toolbar, click Layers, click options next to your travel area layer name (ours is called Walking areas from my house), and click Zoom to.

Now we see all the places we could go.

Apply a smart mapping style
Maria wanted to change the default colors for the travel areas. We used smart mapping to apply a different style to the travel area layer.
1. Click Show properties from your travel area layer options.

2. On the Settings toolbar, at the bottom of the Symbology section (where you see your walking areas), click Edit layer style.

3. In the Styles pane, scroll to Types (unique symbols), and click Style options.
 style selected")
4. Click the Symbol style color ramp to change colors.

5. Click fill color, choose a ramp category, and choose a color ramp.
We had fun looking at various color ramps. We went with Tropical Bliss from the Bright category.

Following these steps, we made a walk-time map. We used it to plan our route.
Where did we go? We aimed for the yellow bridge. But got a bit distracted along the way. There was a dog park. And ice cream cones.
More information about sketch layers, analysis, and layer styles
- Create sketch layers (help topic)
- Analysis basics (video)
- Generate Travel Areas (help topic)
- Apply styles (help topic)
- Get started with ArcGIS Online (tutorial)
This article was originally published on May 4, 2018 and has been updated.

This looks really good but when I followed your instructions, I couldn’t complete Step 3. The option to ‘perform analysis’ doesn’t seem to be there. I was wondering if perhaps the program has changed slightly since this was written?
Hi Rachel – You won’t see the option to perform analysis if you have the Viewer user type or your administrator hasn’t given you publishing privileges. One way to check is to view your licenses in My Settings. More info at https://doc.arcgis.com/en/arcgis-online/get-started/profile.htm#ESRI_SECTION1_63F0EA6DAF5D41E18B1DFCA34C8AF0D7 . Also, Map Viewer Beta doens’t support perform analysis yet. You’ll need to use classic Map Viewer (which is what the article shows).
Hope this helps
Molly
Hello Molly – does this tool take topography into account?
Hi Rob, Currently walk time doesn’t account for topography. It is something we are researching. For now you could reduce the walking speed slightly (default is 5 km/h) if you know you’re running the tool in a hilly area, or do the calculation based on walking distance instead of speed.
Can this work on open terrain like fields?
Hi Jonathan, No, unfortunately you can’t use Generate Travel Areas in open terrain because you need a road network to follow. However, you could create a straight-line buffer based on distance and get something pretty similar. Here are two resources to get you started:
Hope this helps
Molly