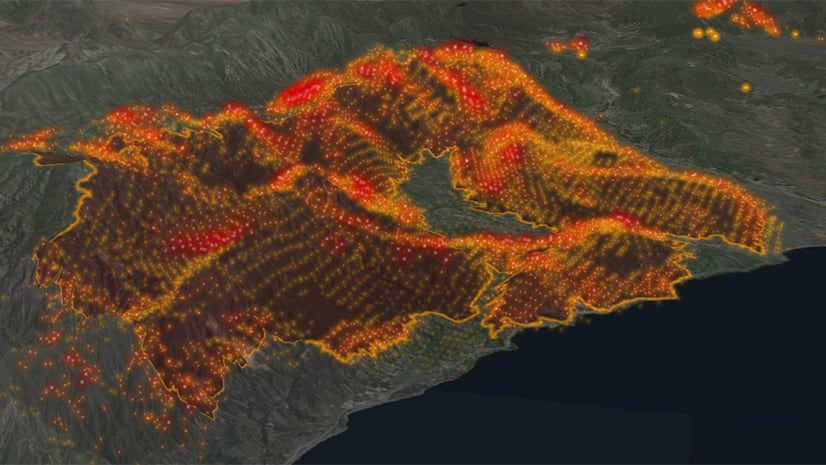
As always, the entire state of California seems to be burning. As this year’s tragic fire season drags on, a well-timed 99 Percent Invisible podcast was released about the flammability of homes during forest fires. After the devastating 1980 Panorama Fire in San Bernardino, California, a USDA Forest Service fire scientist named Jack Cohen noticed that most of the homes that were destroyed had burned were due to embers collecting in the crevices of their wooden roofs rather than contact with the main body of the fire.
By the 1990s, after doing a lot of research (including setting patches of Canadian forests on fire), Cohen developed a theory he called the “Home Ignition Zone”. The survival of a home is largely influenced by flammable debris in the Home Ignition Zone, the area 1000 feet from the perimeter of a home and including the home itself. By removing flammable vegetation and debris from this area, as well as performing preventative maintenance to a home, cleaning dry leaves from gutters and fixing broken shingles, a homeowner can help protect their property from catching fire.

This method isn’t guaranteed to keep homes safe from fires, especially as climate change and drought blend one fire season into the next and intensify flames. But preventative measures can help keep communities intact and homeowners safe from the strain of loss and rebuilding.
In this blog, you’ll calculate the Home Ignition Zone (HIZ) for the Lytle Creek Community Center, a building in the fire-prone San Bernardino National Forest close to the place where the Panorama Fire burned. Using this method, you can calculate these zones for your home, apartment, office, or other places of interest.
Step 1- Create building polygons
1. Sign into your ArcGIS Online organization account.
Note: If you don’t have access to an ArcGIS organizational account, get a free ArcGIS trial.
2. On the ribbon, click Map to open a blank web map.
3. In the search bar, type or paste 14082 Center Rd, Lytle Creek, CA 92358.
This address is for the Lytle Creek Community Center. You’ll use this building polygon for your analysis.

4. On the ribbon, click Add and choose Add Map Notes. Fill out the parameters below and click Create.
- Name: Lytle Creek Buildings.
- Template: Map Notes
5. In the Add Features pane, click Area.
6. Outline the community center by clicking each vertex. Double-click to close the polygon.

When you’re done tracing the structure, a pop-up will open.
7. In the Areas pop-up, name the feature you just created Community Center and click Close.
Now that you have your building polygon, you’ll create buffer zones as outlined by the HIZ strategy.
8. On the ribbon, click Save and save the map to your account.
Step 2- Buffer the structure
The Home Ignition Zone guidelines dictate three important distances:
- Immediate Zone: 0-5 feet including the building
- Intermediate Zone: 5-30 feet from the building
- Extended Zone: 30-100 feet from the building
Each of these zones have specific instructions for creating a defensible space. To calculate these distances, you’ll use the buffer tool.
1. On the ribbon, click Analysis. Expand Use Proximity and choose Create Buffers.
2. Enter the following parameters and click Run Analysis.
- Choose layer containing features to buffer: Lytle Creek Buildings
- Enter buffer size: 5 30 100 feet (to create multiple buffers, separate distances with a space)
- Result layer name: Community Center Buffer(yourname)
- Make sure Use current map extent is checked
Note: Add your name or initials to the Result layer name to make the analysis result unique. Each piece of content within an organization must have a unique name.
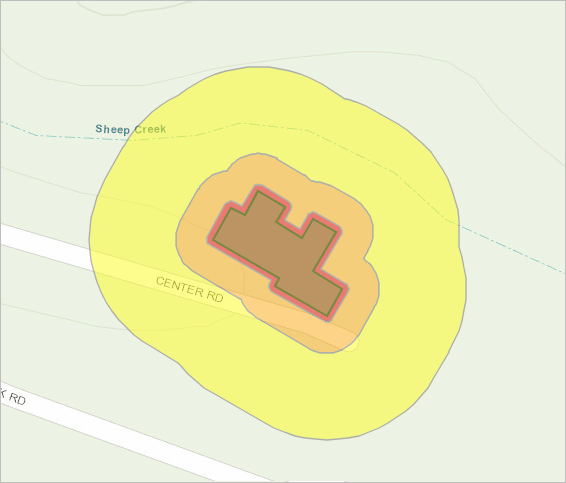
Once the tool runs, the buffer rings are added to the map.

Each ring symbolizes one of the zones. The blues and greens of the default buffer don’t show the fire safety theme very well, so you’ll change their symbology.
3. In the Contents pane, hover over Community Center Buffer and click Change Style (triangle, square, and circle button).
4. Under Select a drawing style, for Types (Unique symbols), click Options.
The distances are listed next to the current color they’re symbolized in.
5. Under Label, click each color box to change the buffer ring’s color as listed below. When you’re happy with the symbology, click OK, then click Done.
- 5 feet – red
- 30 feet – orange
- 100 feet – yellow
The Immediate Zone also includes the building itself, so you’ll change the polygon color to the same red you used for the innermost buffer ring.
6. On the ribbon, click Edit. On the map, click the Community Center polygon and choose Change Symbol from the pop-up.
7. In the color selector window, change the Fill color to the same red you used for the smallest buffer, and change the Outline color to a black line. Click Close.
8. On the ribbon, click Save and choose Save. In the Save Map window, type a title, tags, and summary, then click Save Map.

Step 3- Customize pop-ups
Now you’ll add more information to the map in the form of pop-ups. When you click on a buffer ring, a window opens showing the buffer layer name and default information. To provide more information to yourself and anyone else who views your map, you’ll customize these pop-ups.
1. In the Contents pane, hover over the Community Center Buffer layer and click More Options (three dots). Choose Show Item Details.
Before you can edit the data, you must enable editing. This is not a default feature in case you plan on sharing the layer- in many cases, you don’t want others to have geoediting access to your data.
2. In the buffer layer’s item details page, on the ribbon, click Settings. Under Feature Layer (hosted), check the Enable editing option and Save your changes.
3. Close the item details page and return to your map.
4. Hover over the buffer layer and click Show Table.
A layer’s attribute table contains all the data associated with each feature on the map. The attribute table for the buffer has three records, one per ring. You’ll add information for each ring to the attribute table.
5. Double-click the first cell in the Title column corresponding to the 5-foot buffer ring. Rename the ring Immediate Zone and press Enter to save your edit.
Note: If double-clicking a cell doesn’t make it editable, refresh the map to update the layer properties.
6. Rename the 30-foot ring Intermediate Zone and the 100-foot ring Extended Zone.
7. In the Description column, paste the following information, then close the Attribute Table.
- Immediate Zone: The home and the area 0-5 feet from the furthest attached exterior point of the home; defined as a non-combustible area. This area is the most vulnerable to embers- start with fire-resistant improvements to the house itself and then move into the landscaping section of the Immediate Zone.
- Intermediate Zone: 5-30’ from the furthest exterior point of the home. Clear debris and use landscaping or hardscaping that removes flammable vegetation and creates breaks that can help decrease fire risk.
- Extended Zone: 30-100 feet, out to 200 feet. Focus on landscaping that will interrupt a fire’s path and keep flames smaller and on the ground, including making sure trees are spaced out far enough.
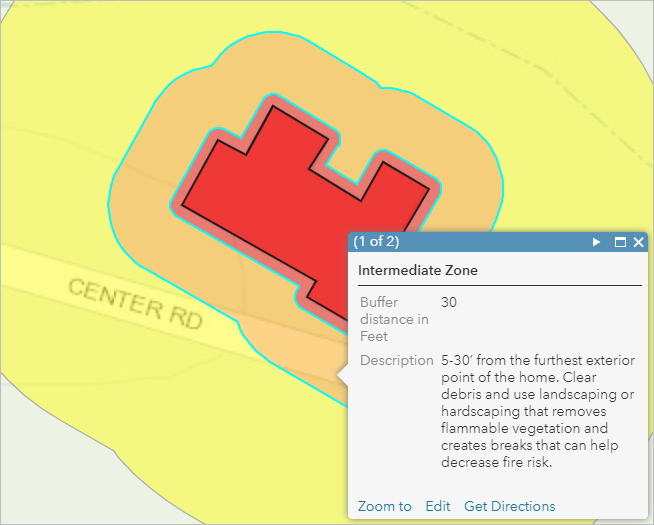
When you click on any of the buffer rings now, the pop-up will show relevant information about the actions that should be taken in that area. The formatting isn’t clean, though, which you’ll fix next.
8. Hover over the Community Center Buffer layer and click More Options, then choose Configure Pop-up.
9. For Pop-up Title, delete the default text, then click the plus button to the right of the text box.
The plus button lists the layer’s attributes.
10. Choose Title from the attribute list.
When applied, calling the {Title} attribute will make each ring’s individual name appear as the pop-up title.
11. Under Pop-up Contents, for Display, choose A custom attribute display, then click Configure.
The Custom Attribute Display window opens.
12. In the text box, type {Description}.
Like you did with the title, calling the attribute {Description} will show each ring’s individual description field.
13. Press Enter twice and paste the following text: Source: National Fire Protection Association
If necessary, manually add a link to the NFPA’s information page (https://www.nfpa.org/Public-Education/By-topic/Wildfire/Preparing-homes-for-wildfire) by clicking the Create Link button on the Custom Attribute Display ribbon.
14. Click OK in the Custom Attribute Display box and again to close the Pop-up pane.

15. Save the map.
Now that you have a symbolized map with informative pop-ups, you can choose to share it with others, create an app, or even use the Map Notes template to perform analysis on your own house or neighborhood. If you plan on sharing the map, make sure to disable editing permissions on the layer so viewers can’t change your analysis.
For more step-by-step analysis on the impacts of natural disasters, try a Learn ArcGIS lesson:


Commenting is not enabled for this article.