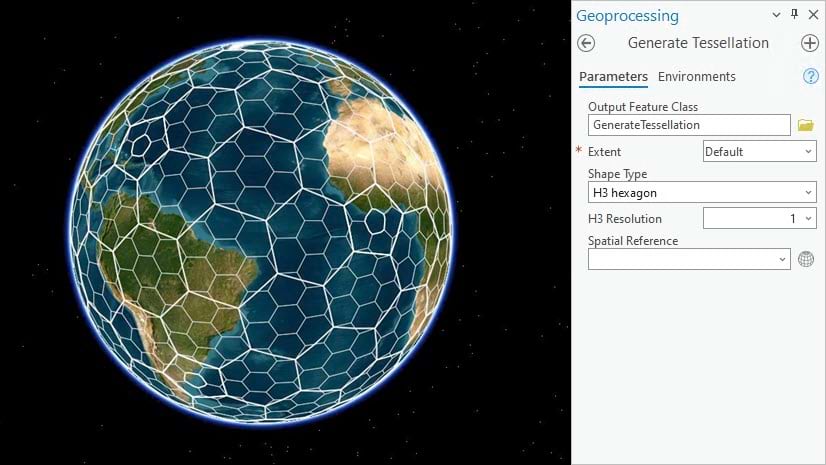
With the June 2023 release of ArcGIS Online, you can now use the Generate Tessellations tool to generate H3 hexagons, an open-source, hierarchical spatial indexing system created by Uber in 2018.
Why use hexagons?
Hexagons are one of the most optimal shapes for spatial analysis due to their tessellation pattern being completely equidistant to all their neighbors (a feature not shared by other common tessellation types, such as triangle or square geometries). Having neighboring polygons equidistant helps to reduce sampling biases that might be observed using other shape types. Hexagons are also less prone to the effects of distortion caused by the curvature of the Earth because of their many sides and obtuse angles. To learn more about the power of the hexagon tessellation in analysis, check out the ArcGIS Pro topic Why hexagons? and blog article Got five minutes? Get to know hexagons.
Why use H3 hexagons?
H3 hexagons are an open-source, hierarchical tiling index that generates hexagons at predetermined locations on the globe based on one of sixteen different resolutions. Hierarchal hexagons are sized such that every larger polygon is divided into seven equal-sized smaller hexagons that all have an equal distance to the center of their neighbors, as seen in the image below.

The largest hexagons that can be created from this tool are resolution 0 and have an average area of 4,357,449.42 km². The largest resolution, 15, produces the smallest hexagons at approximately 0.895 m² in size, as defined by the resolutions on the H3 library documentation page.
Want to learn more about H3 hexagons? Check out these resources on Uber’s Hexagonal Hierarchical Spatial Index and the ArcGIS Pro tools that already have H3 hexagons: Generate Grids and Hexagon and Generate Tessellations.
H3 hexagons will always align
One benefit of H3 hexagons is that the tessellations will always align. H3 hexagons are generated at predetermined locations based on their bin resolution. Therefore, tessellations of the same resolution will never overlap. Each tessellation has a GRID_ID field representing its location that is common among any H3 generation software.
Using H3 hexagons in the Generate Tessellations tool
To create an H3 hexagon tessellation in ArcGIS Online:
- Open Map Viewer and access the Analysis pane.
- Search for the tool: Generate Tessellations.
- Use the drop-down menu to select H3 hexagon as the Bin shape type.
- Once you select H3 hexagon, a new parameter appears called H3 bin resolution where you can pick a resolution value from 0, the largest bins, to 15, the smallest bins.

When you are generating tessellations, you need to define an extent layer. You can do this using one of two options:
- Define an extent using the extent layer parameter. When you select this option, you can choose to only create tessellations that intersect features in the extent layer.
- Define a processing extent in the environment settings. The processing extent can be defined by a set of coordinates, the display extent, or a layer.
It is important to note that H3 hexagons are always generated using the World Geodetic System 1984 (WGS84) spatial reference (wkid: 4326). There are two cases where you may get a warning message about your spatial reference:
- If an output coordinate system is set through the environment settings, and isn’t WGS84, a warning will be displayed telling you that your output coordinate system will not be used.
- If your input dataset is in a different spatial reference than WGS84 a warning will be displayed that WGS84 has been applied.
In both cases, the analysis will run in WGS84 and you don’t need to make any changes.
Example: Analyze urban street-tree density with H3 Hexagon tessellations
One of the most common applications for using Generate Tessellations with H3 hexagons is to create a grid of polygons for spatial analysis that have equal size and distances to neighbors, therefore reducing instances of size bias. Size bias is a phenomenon akin to map area bias where larger objects appear as more significant on maps and can express misleading information to viewers without the use of proper data normalization. This example will explore urban street-tree density in Waterloo, Canada, and the differences in summarization between buffered roads and H3 tessellations.
Add and clean the data
To follow along with this example, sign into ArcGIS Online and add the following data layers from the City of Waterloo to the Map Viewer. They are called Roads, Street Tree Inventory, and City of Waterloo Historical Boundary and can be found by changing the search parameter dropdown to ‘ArcGIS Online’ and searching for ‘City of Waterloo’.
 and tree type (street or cemetery)")
Upon inspecting the Street Tree Inventory attribute table, it is clear that not all of these points will be relevant for a survey on street trees. In the image above, notice that some of the points within this layer to are stumped, are trees that are planning to be removed, or aren’t located on streets. To remove these trees from analysis, filter the trees layer. To do this, open the Filter pane using the Filter button on the Settings (light) toolbar of the map window, and add the following two expressions ‘TREE_TYPE is Street’ and ‘STATUS is Existing’ to refine the Street Tree Inventory points layer to only include still–standing street trees.

Display street tree data using Summarize Nearby
In this section, the Summarize Nearby tool will be used to summarize the trees within 16 meters of roads. This layer will be used again later to compare bias against a layer summarizing tree inventory within H3 hexagon tessellations.
To create the first polygon, open the Analysis pane and search for the tool Summarize Nearby. Update the parameters as follows:
- For Input features, select the Street Tree Inventory – Street Trees point layer.
- For Nearby layer, select Roads.
- For Measurement values, type 16 and click Add.
- Change Units to Meters.

5. Click Estimate credits.
6. Click Run.
The resulting output layer is a polygon that is 16 meters on both sides of the center of the road. Sixteen meters was used to accommodate the widths of the roads in addition to the distance trees are planted from roadways.
To make the output maps easier to see, the symbology was changed in the following ways:
- Basemap: Dark Gray Canvas with the reference layer turned off.
- Layer style: Counts and Amounts (color) with a High to Low theme.
- Fill color: Green 1, with 100% transparency added to polygons containing zero street trees.
- Classification: Manual breaks with six classes.

The output map now shows the road buffers in different shades of green depending on the number of street trees located within the polygon. With darker roads containing more street trees than lighter roads, and streets with no trees appearing transparent.
Create H3 hexagons using Generate Tessellations and summarize street tree data using Summarize Within
Next, use the Generate Tessellations tool with the following options:
- For Bin shape type, choose H3 hexagon.
- For H3 bin resolution, enter 10.
- For Extent layer, choose the City Boundary (Historical) polygon layer.
- Check Only keep intersecting tessellations.
5. Click Estimate credits.
6. Click Run.
The following tessellation layer consists of H3 hexagons of bin resolution 10 that intersect the Historic City of Waterloo boundary.

Run the Summarize Within tool to analyze the number of street trees residing within each H3 hexagon using the following parameters:
- For Input features, select Street Tree Inventory – Street Trees.
- For Summary polygon layer, select the H3 hexagons tessellation layer.

3. Click Estimate credits.
4. Click Run.

Change the symbology of the output to match that of the roads, as described earlier, so that the H3 hexagons appear in five different shades of green depending on how many street trees are located within them. Darker hexagons contain more street trees, lighter hexagons contain fewer trees, and hexagons with no street trees display as transparent.
Example Conclusion
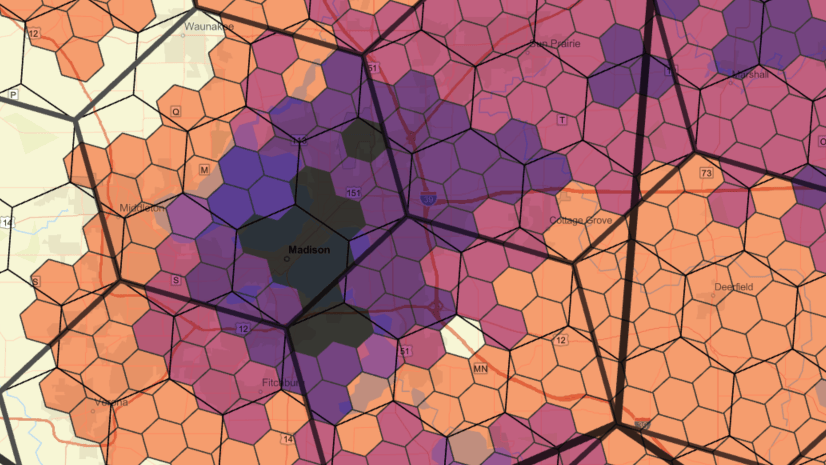
Upon first looking at the Summarize Nearby output using road polygons, it appears that the coverage of street trees is much greater across Waterloo when compared to the Summarize Within H3 hexagon map. Roads that appear green are drawn through locations that are represented by transparent hexagons. This is an indication that the road buffer map is incorrectly showing street trees in areas where there are none.
To showcase these areas, the two summary layers have been added together to the map with the roads Summarize Within layer changed to a solid orange color, to better show the areas where there is no overlap. These exposed lines on the map are areas where street tree density is being misrepresented by the roads buffer layer.

This is a form of size bias caused by the road polygons showing the same color throughout the whole length of the street, even though trees are not planted uniformly down them. The H3 hexagon output does a much better job at identifying the areas with a high amount of street trees regardless of the length of the road they are on. Using equal sized hexagons, like H3, removes the bias that using irregularly shaped polygons can introduce.
Conclusion:
You can now use H3 hexagons in the Generate Tessellations tool. Through this article, we have shown how the use of H3 hexagons can reduce instances of size bias which is useful for a variety of spatial analysis at any scale or location. H3 hexagons are one of the many new features that have arrived with the June 2023 release of ArcGIS Online and we hope you try using them in your next project!
Sources:
- City of Waterloo. (2016). City of Waterloo Historical Boundary [Data file]. Retrieved June 8th, 2023, from https://services.arcgis.com/ZpeBVw5o1kjit7LT/arcgis/ rest/services/CityBoundaryHistorical/FeatureServer
- City of Waterloo. (2018). Street Tree Inventory [Data file]. Retrieved June 8th, 2023, from https://services.arcgis.com/ZpeBVw5o1kjit7LT/arcgis/rest/ services/Street_Tree_Inventory/FeatureServer
- City of Waterloo. (2022). Roads [Data file]. Retrieved June 8th, 2023, from https://services.arcgis.com/ZpeBVw5o1kjit7LT/arcgis/ rest/services/Roads/FeatureServer

Article Discussion: