The December 2021 update of ArcGIS Online added performance updates for the user experience when styling layers using Arcade expressions. The faster performance is especially noticeable in very large layers.
For example, suppose you authored an expression based on numeric data and classified it into categories.
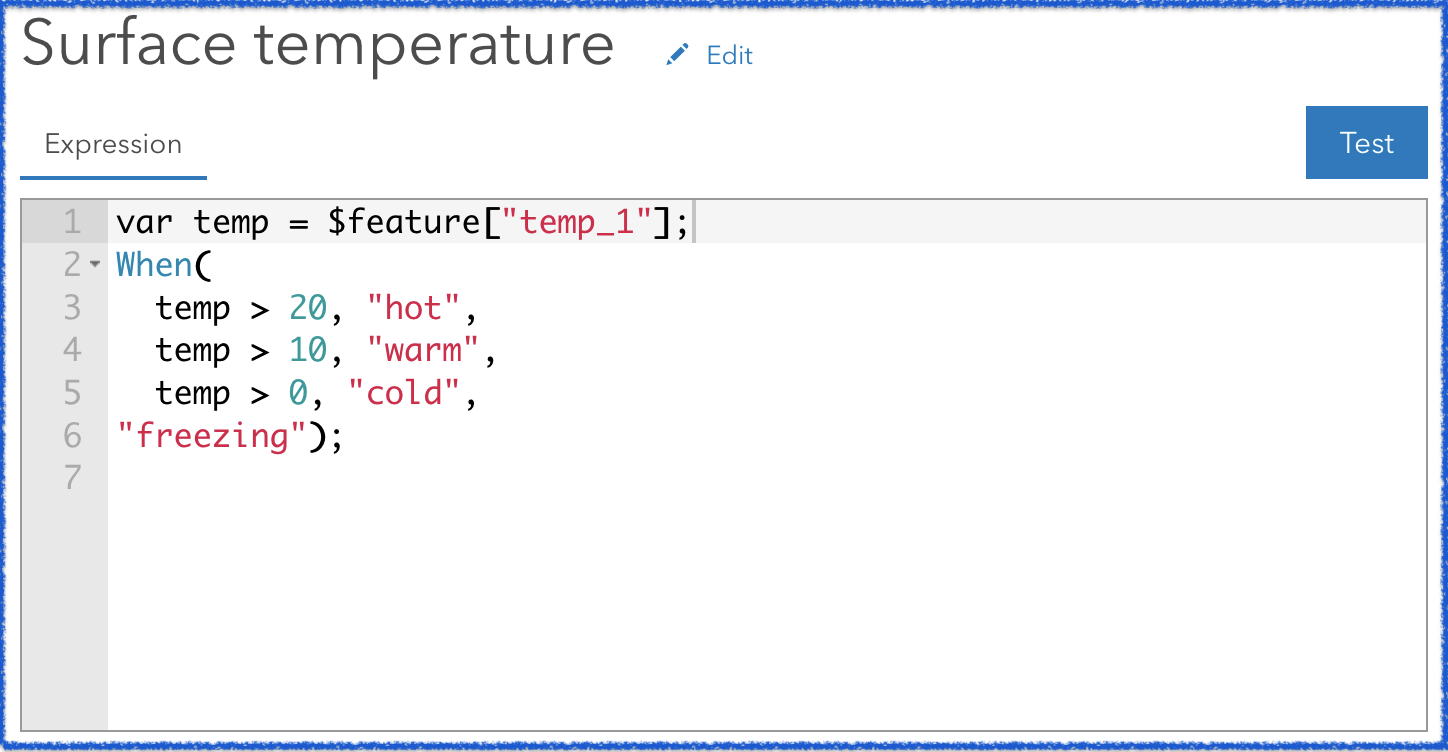
Prior to the update, the browser might have frozen for several seconds in this scenario. That can feel like an eternity in online workflows.
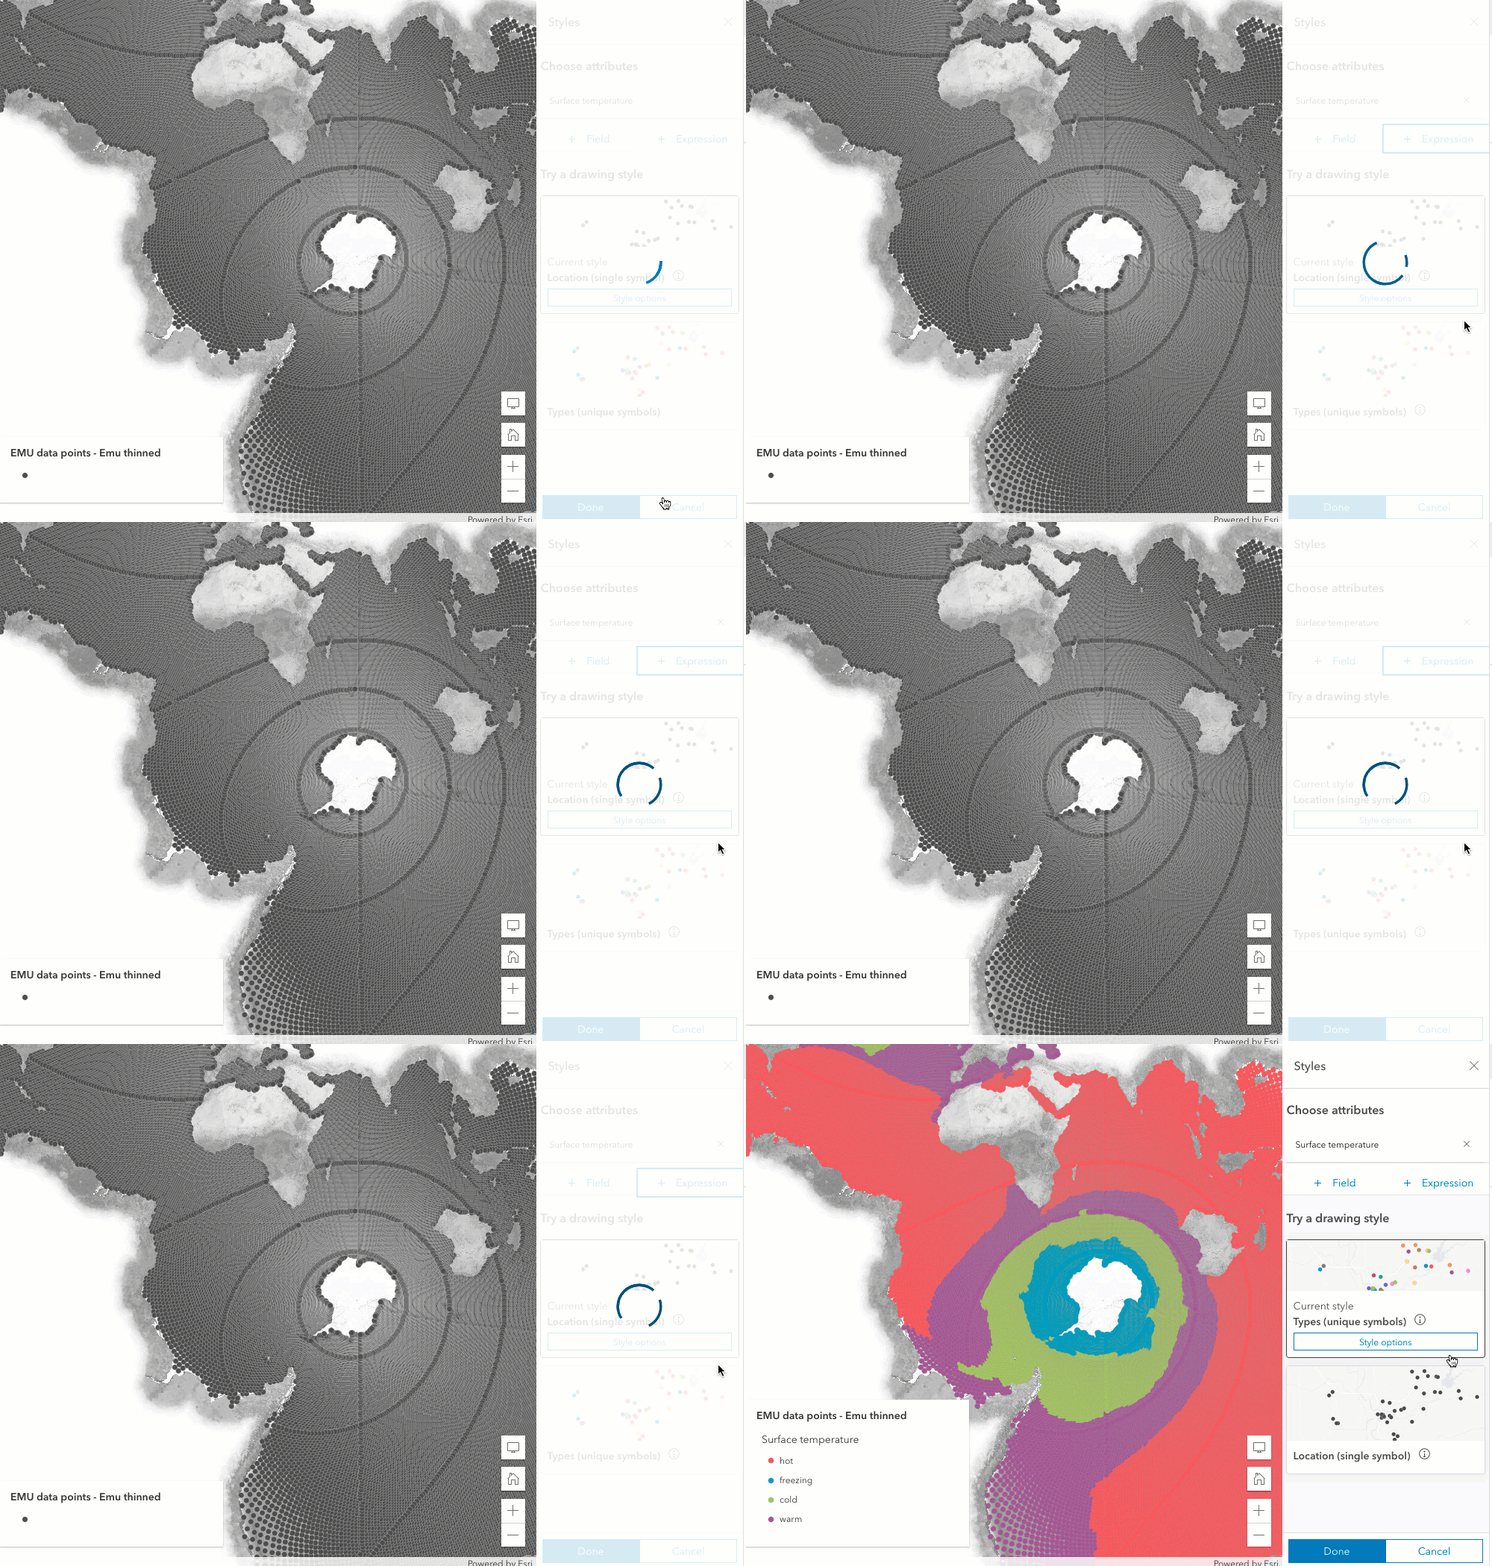
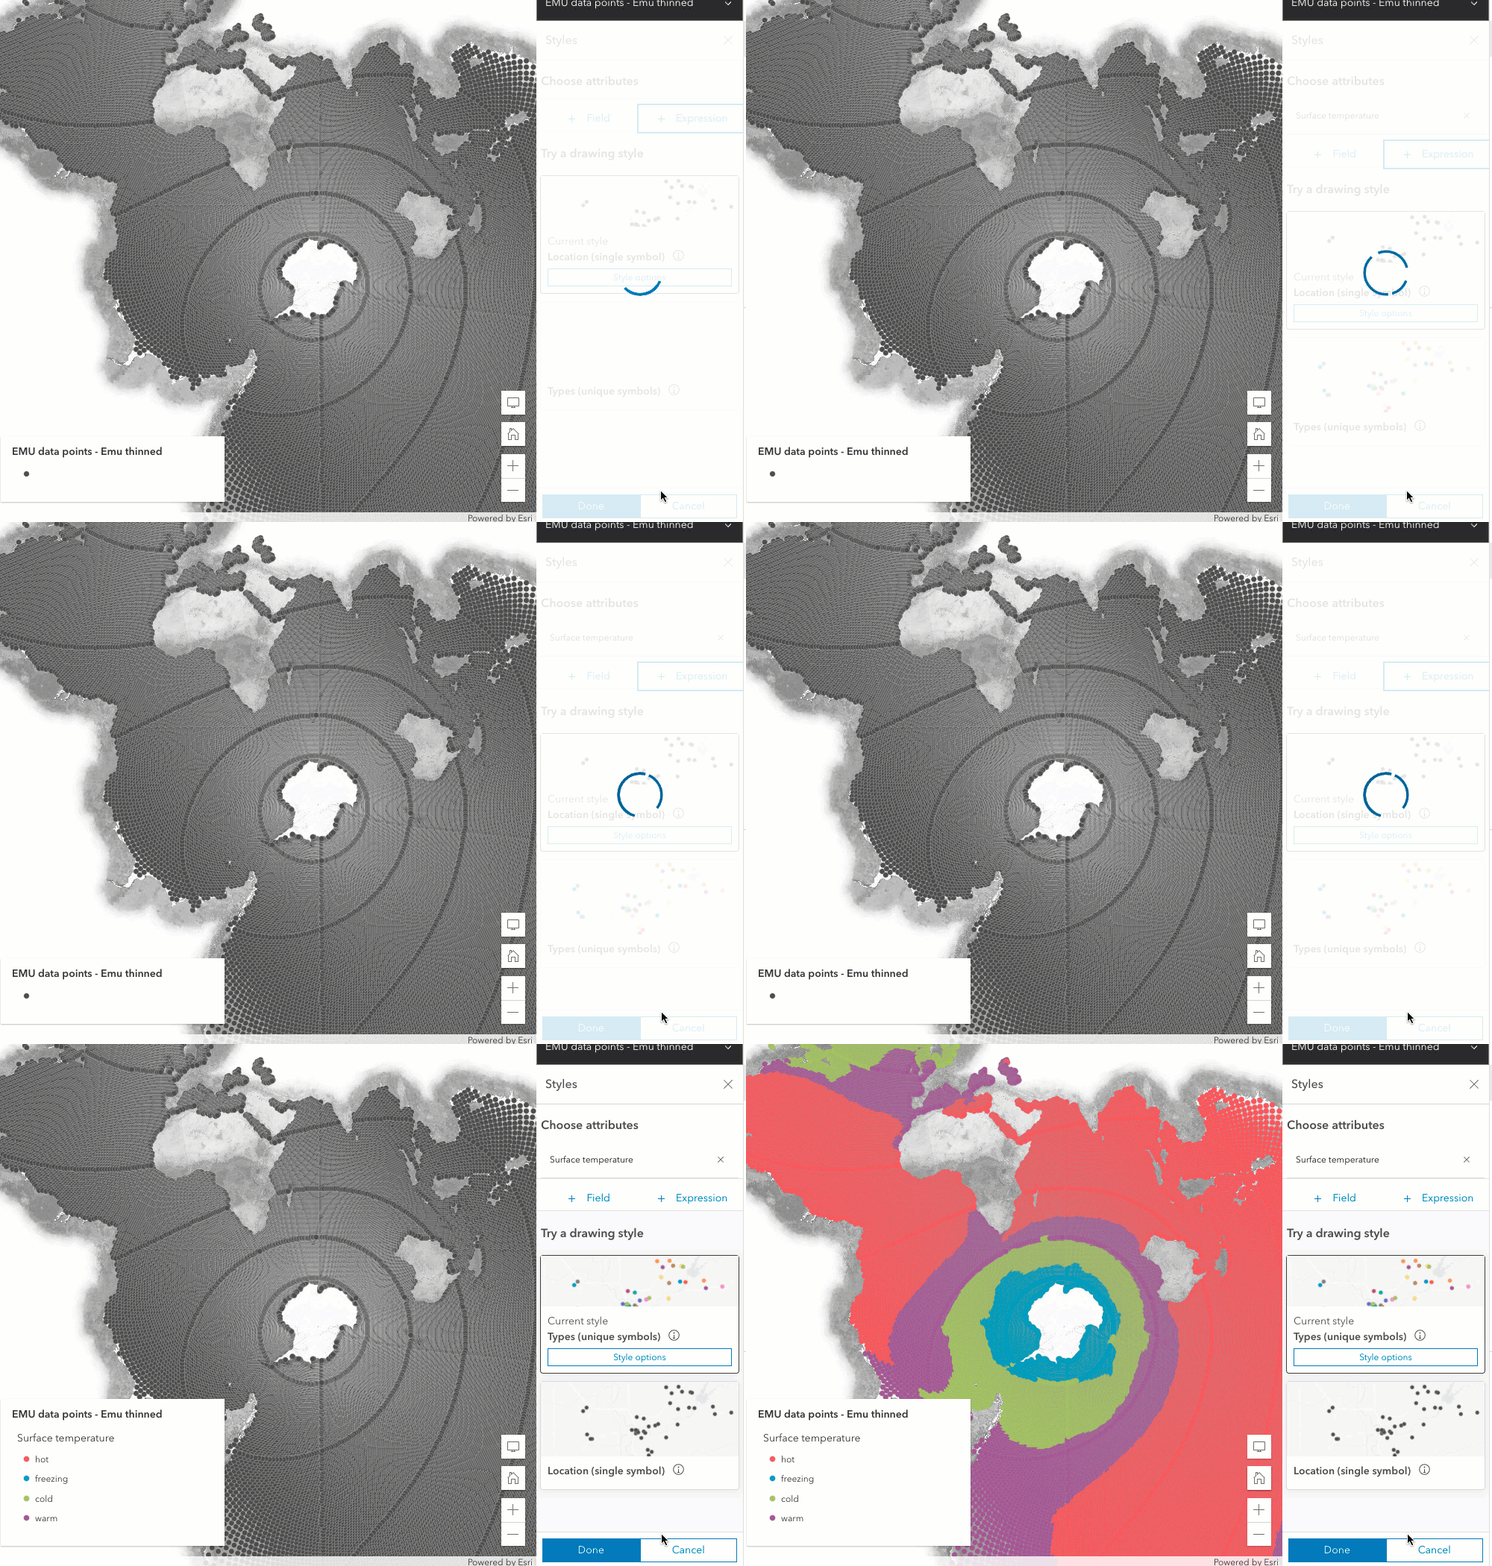
After the update, the performance is nearly 10 times faster for calculating unique values.
There is also a noticeable improvement when configuring additional properties for continuous color and size styles. Initially, the suggested style is generated quickly. However, if you want to modify the settings, you might have encountered similar UI freezing.
In the recording below, notice how it takes a long time for the histogram to generate and render on the slider.
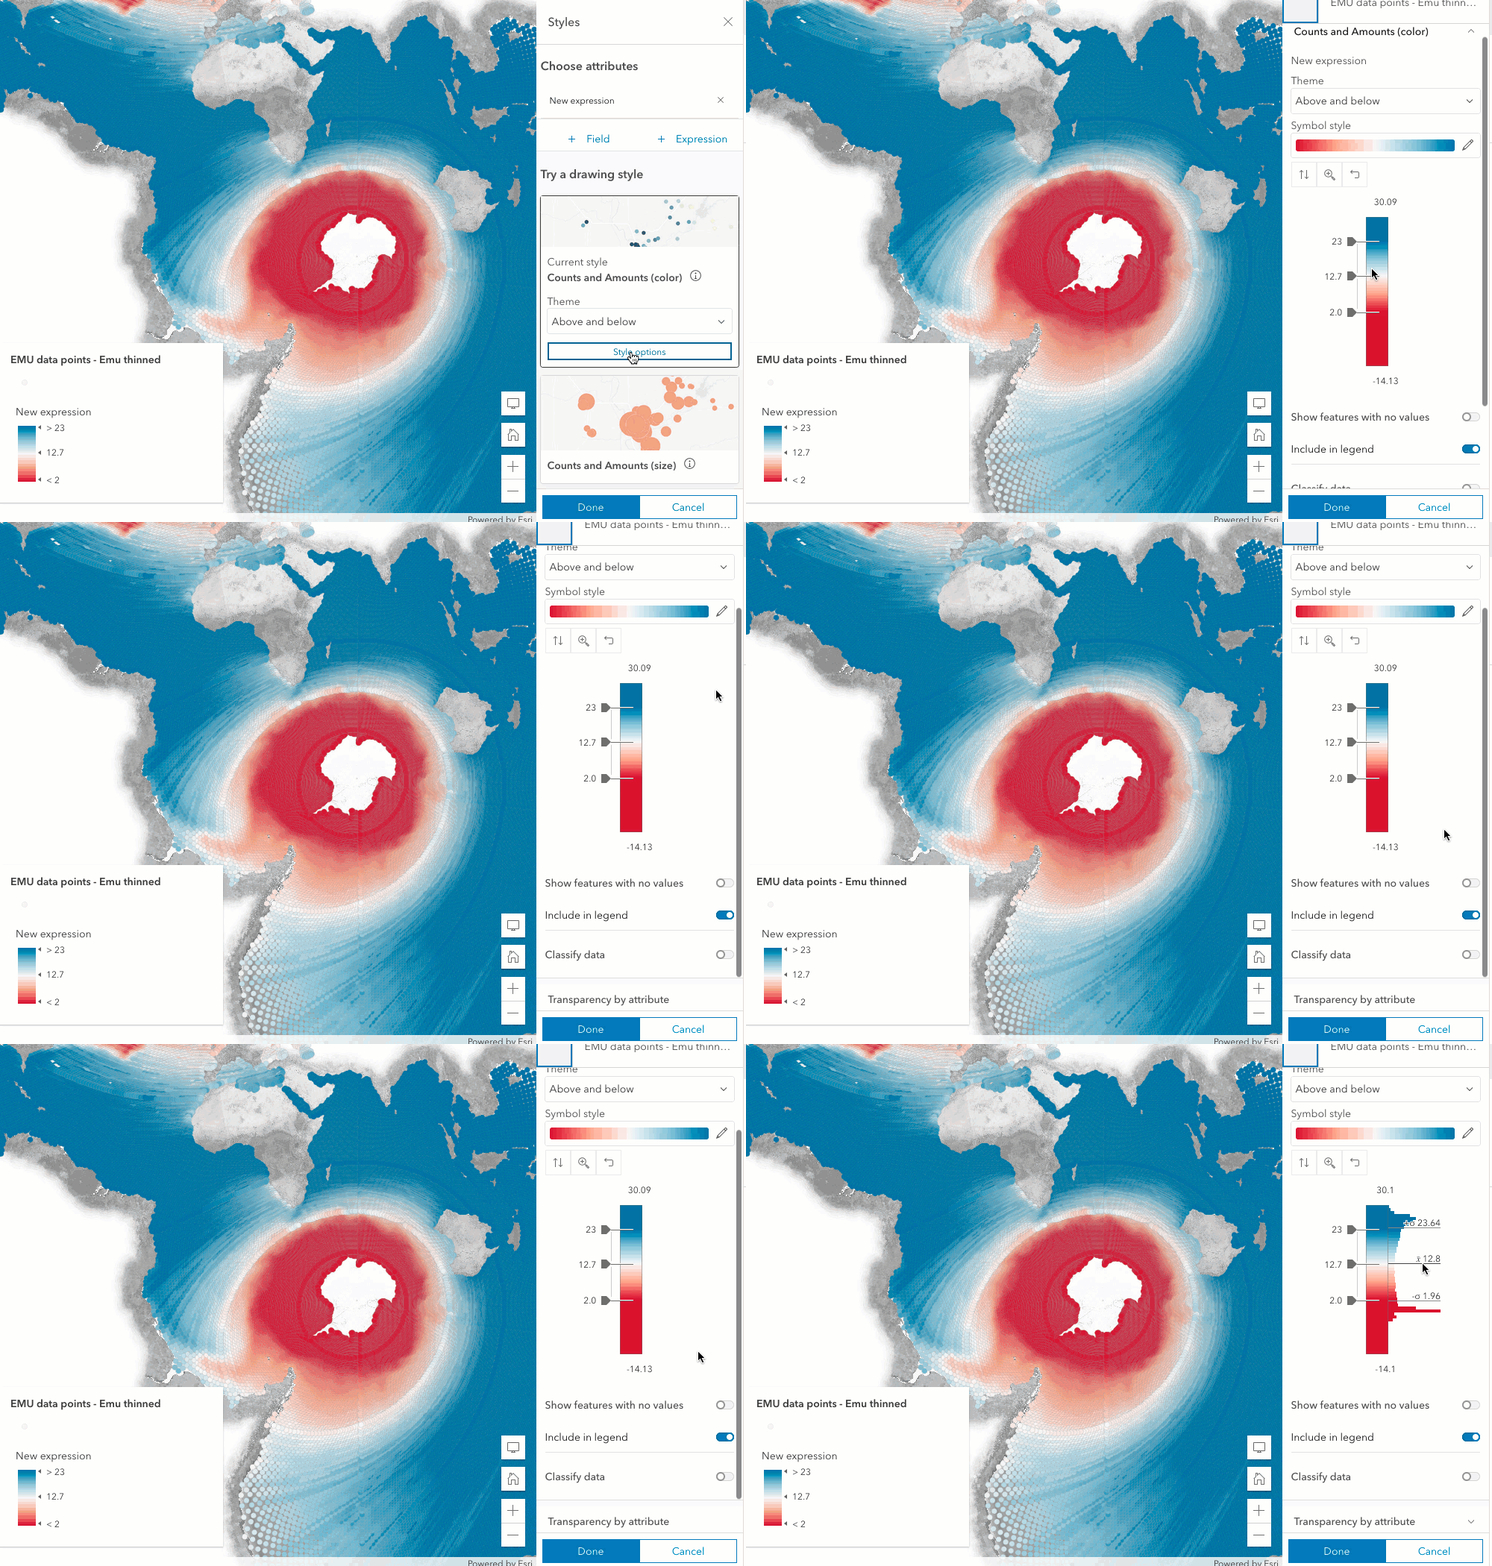
Similarly, you would have to wait through several seconds of UI freezing if you toggled the switch for classifying data. Again, the delay makes the user feel like the app is broken.
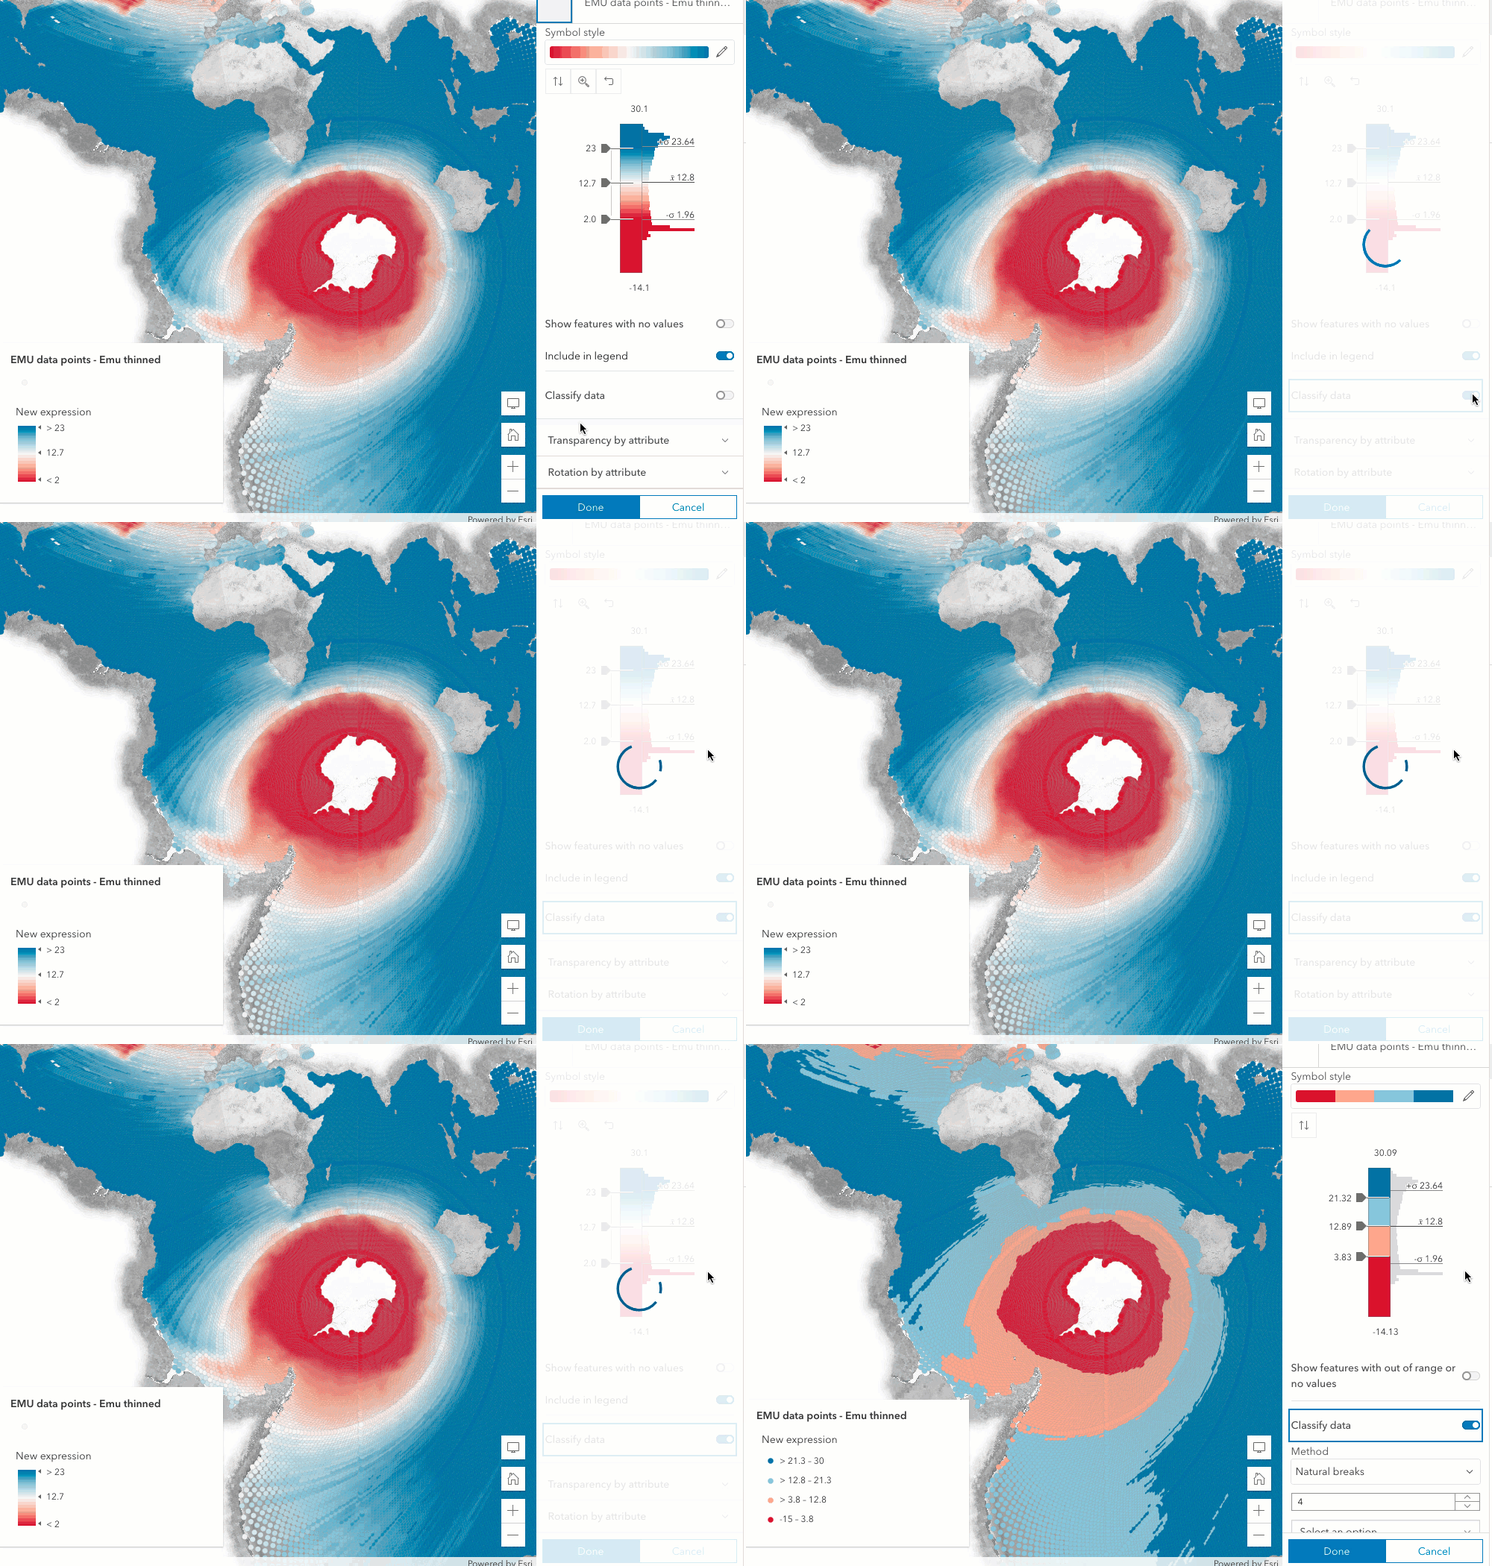
As of the December update, the styling panel now opens immediately, rendering the histogram on the slider in less than a second. The performance is also improved for class breaks, calculating the breaks in less than a second. This is much faster, making for a more pleasant experience when styling layers.
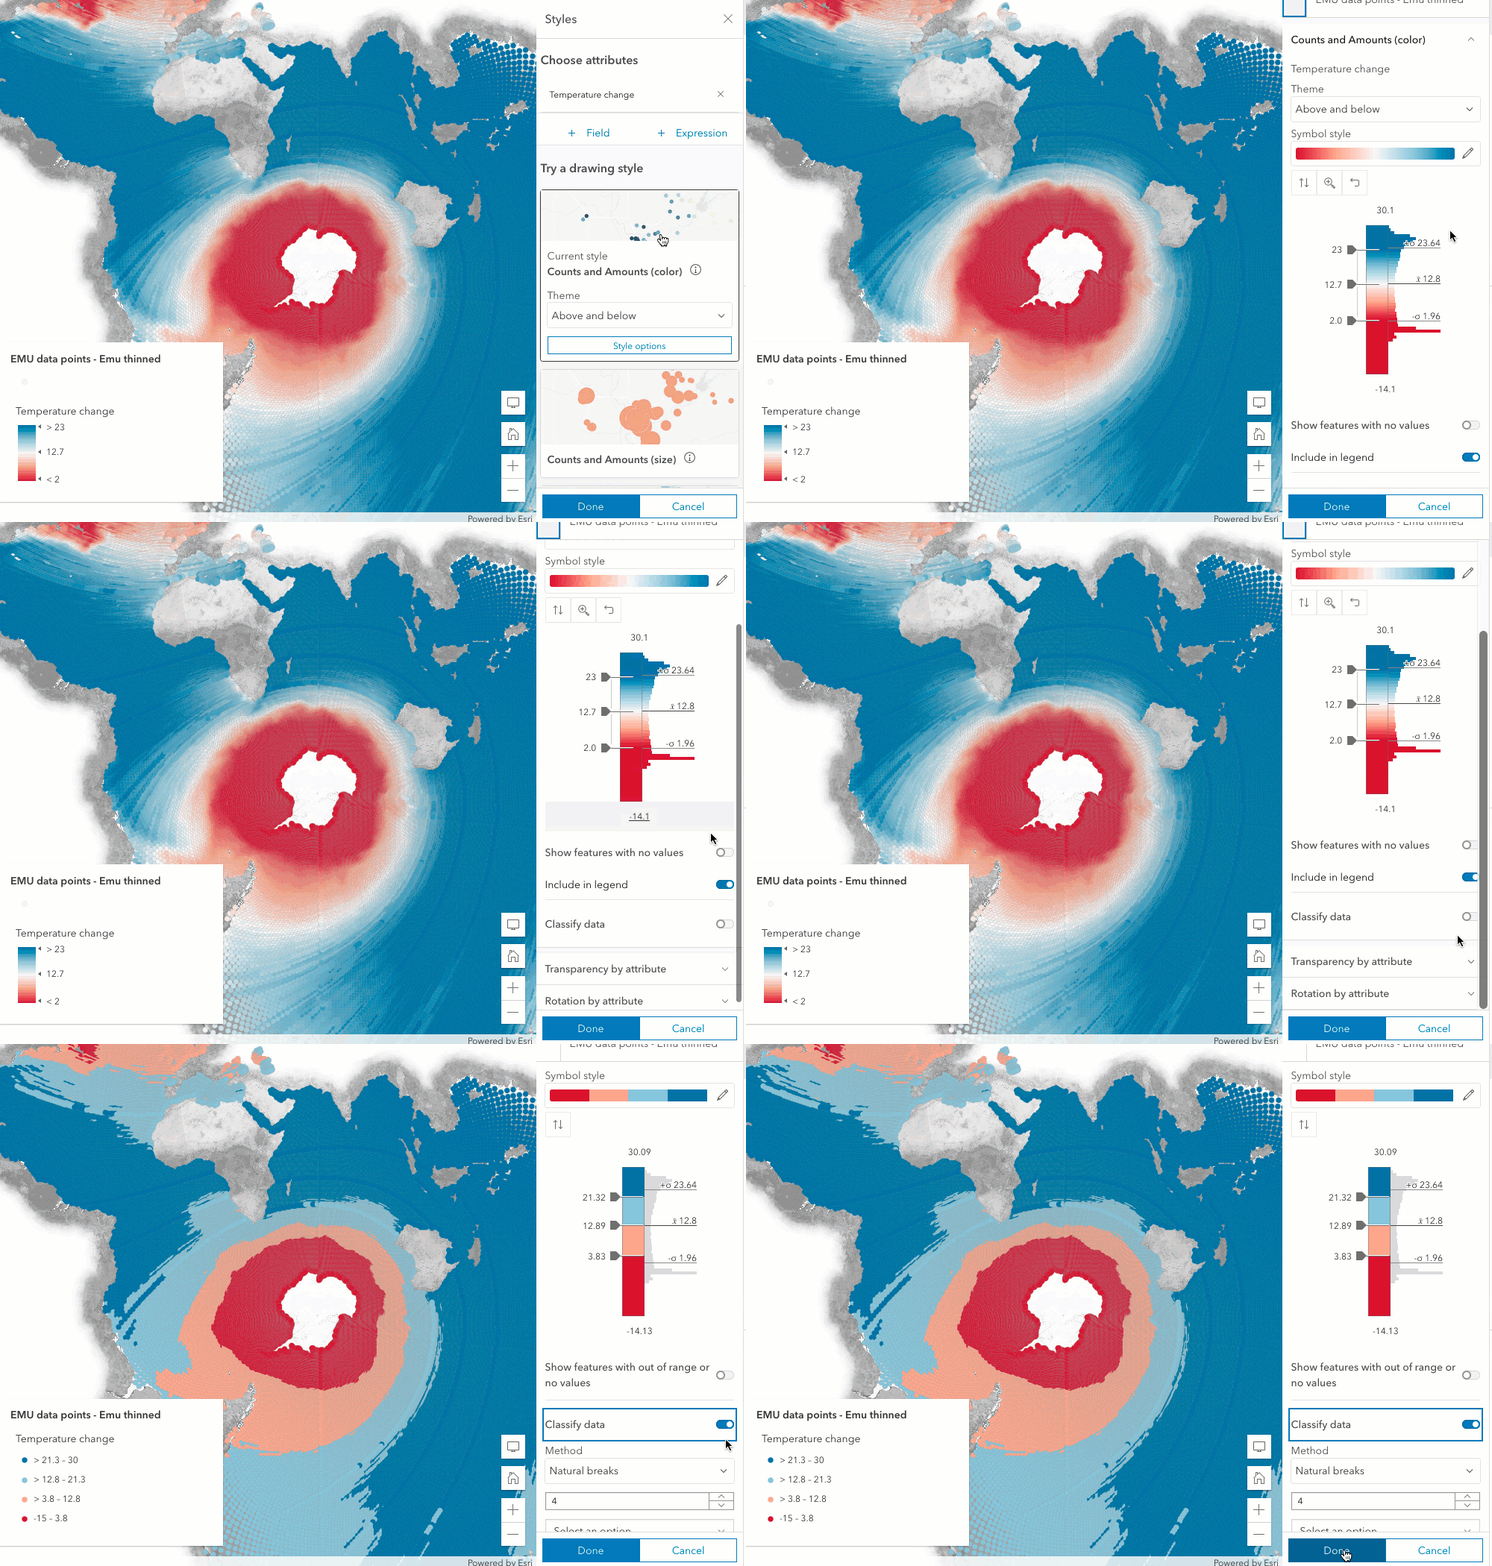
What changed?
The styles panel uses Smart Mapping to help users make smarter choices about styling their data. This means empowering you with information, including statistics and histograms annotated with critical values that summarize the spread of a dataset. It also provides access to interactive sliders, controls, symbols, and hundreds of well-designed color ramps that give you control over finishing what smart mapping starts.

When you select a field in a service-backed layer, the statistics and histogram Smart Mapping provides you are queried directly from the server. However, when you author an Arcade expression, the Map Viewer must calculate statistics from the expression directly in the browser since feature services don’t support Arcade.
Calculating these statistics used to be burdensome because they previously executed on the browser’s main thread. That is what caused the freezing observed in the recordings at the top of this post. In December, the logic for calculating statistics moved from the main thread to worker threads. This prevents UI freezing and returns the results faster.

You can think of this as standing in line to buy food at a grocery store register. Imagine having a cart full of food and discovering that only one register is open with a line of other shoppers backing up to the end of the store. Compare that experience with having 10 open registers with quickly moving lines. This allows you to choose the shortest line so you can make your purchase and leave the store faster.
In a similar fashion, the statistic calculations previously had to wait in a queue of other tasks to finish their calculations. Now they have moved to smaller queues (i.e. workers), which means they can be resolved more quickly without blocking other logic in the app.
Creating a good experience for non-ArcGIS data sources
The logic for calculating statistics for Arcade expressions is the same code path as calculating statistics for any data source not backed by an ArcGIS feature service or map service. Since data sources, such as GeoJSON and CSV, exist as text files, the browser needs to bear the burden of calculating statistics for data from those layer types.
The performance improvements described above helped create a good experience for styling data in CSV and GeoJSON layers, which can now be added to ArcGIS Online maps by URL starting at the December 2022 update.
Go ahead and try it out today! Click the Add option at the top left portion of the app, and select either CSV or GeoJSON from the menu.

Then paste the URL to the resource you would like to add to the map.
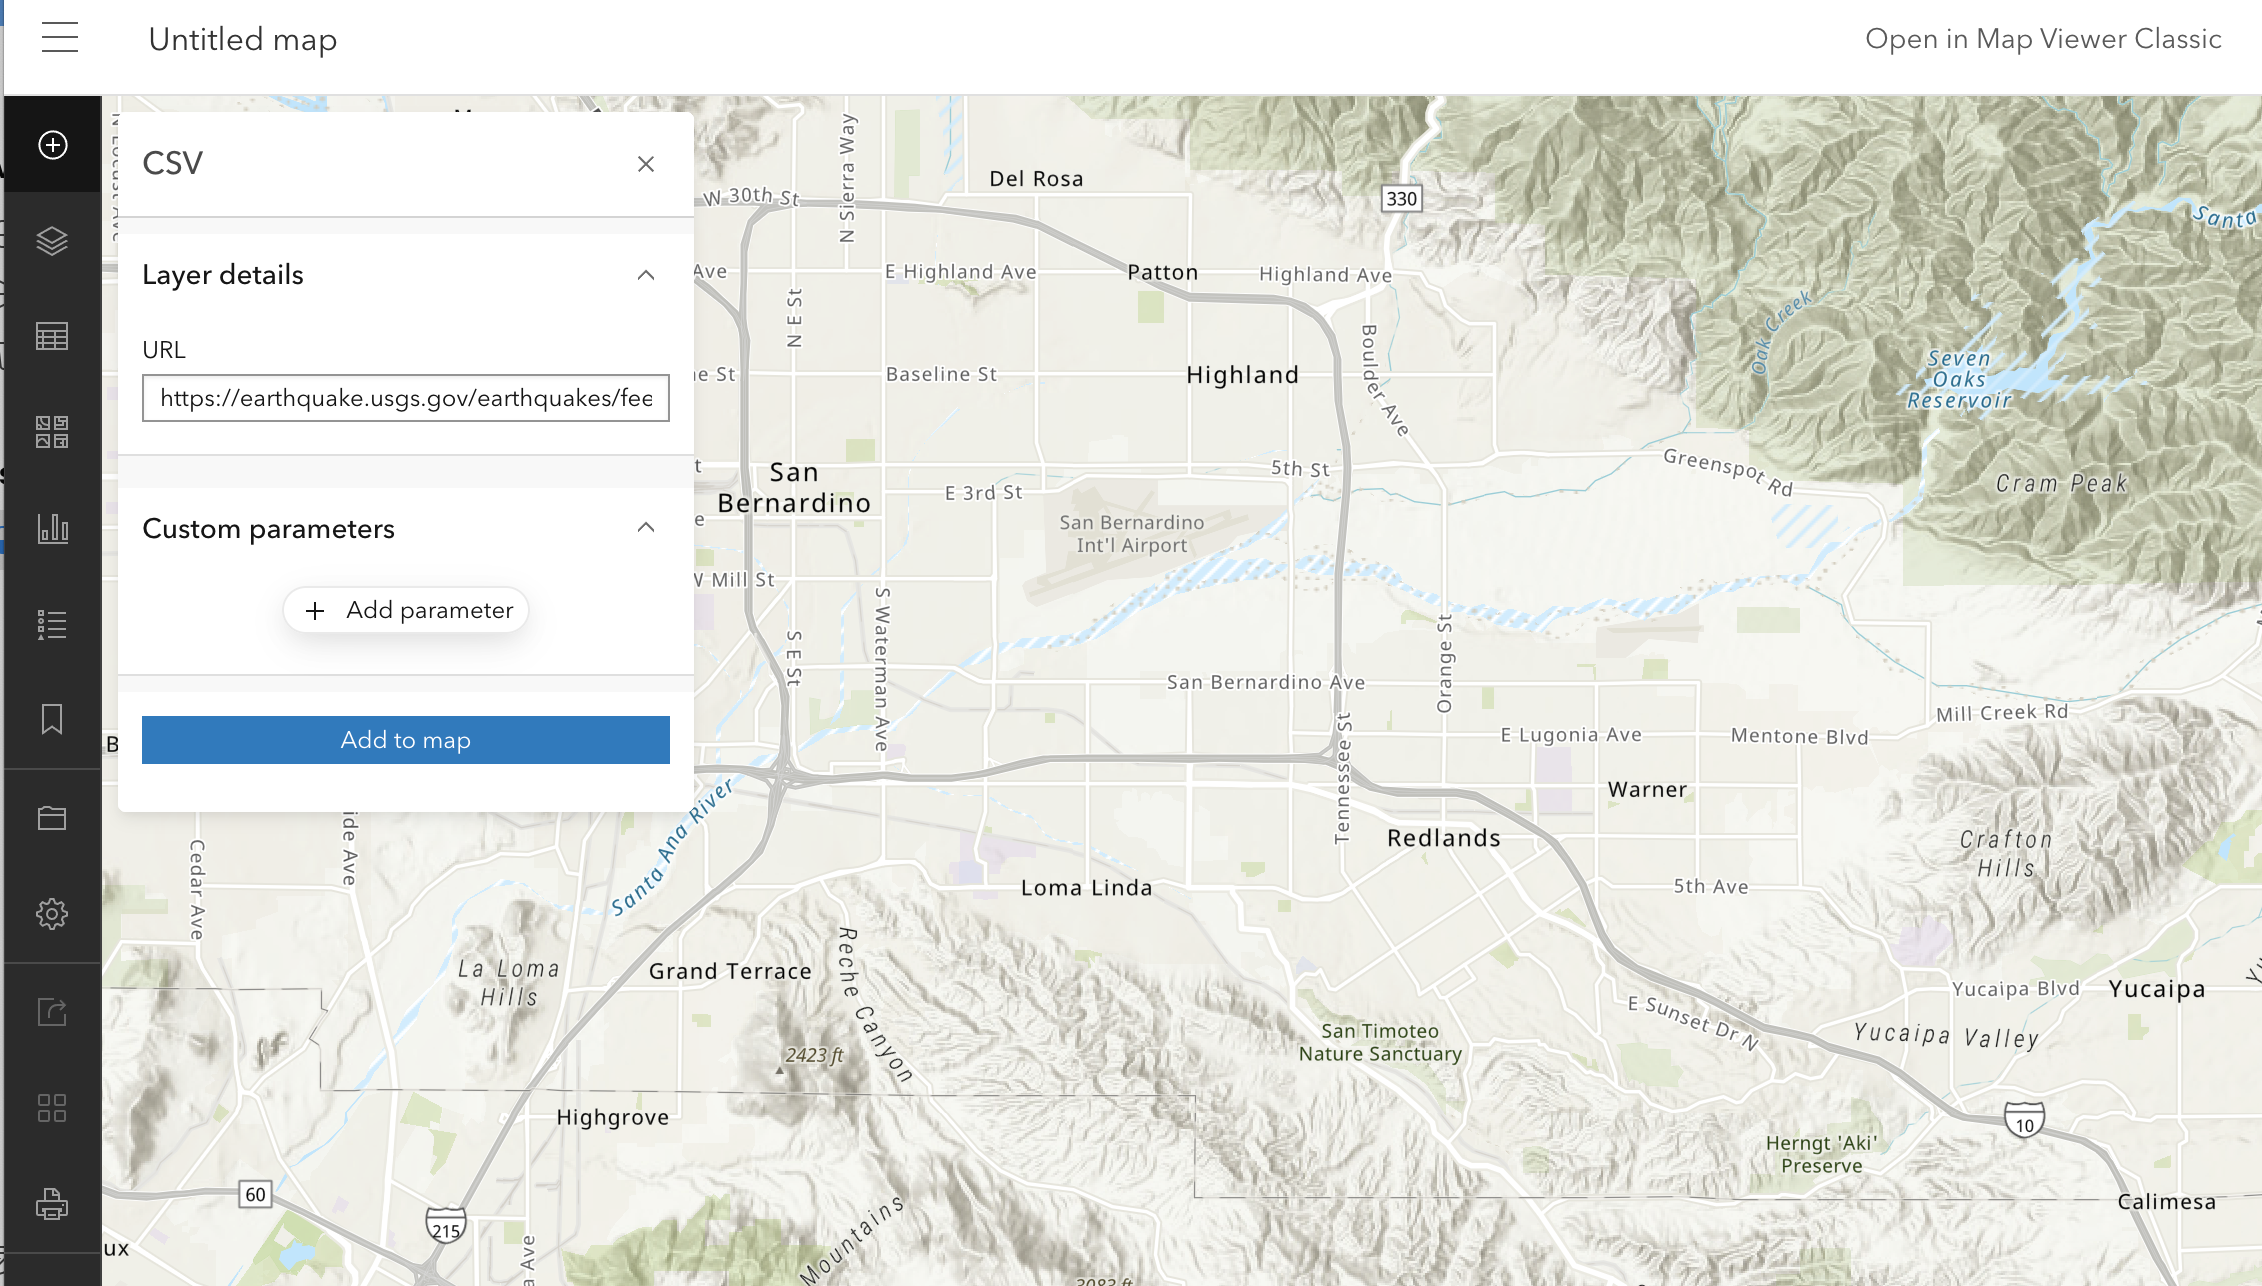
Once the data is added, you can configure the layer’s style, filters, popups, and labels as you would any other FeatureLayer.
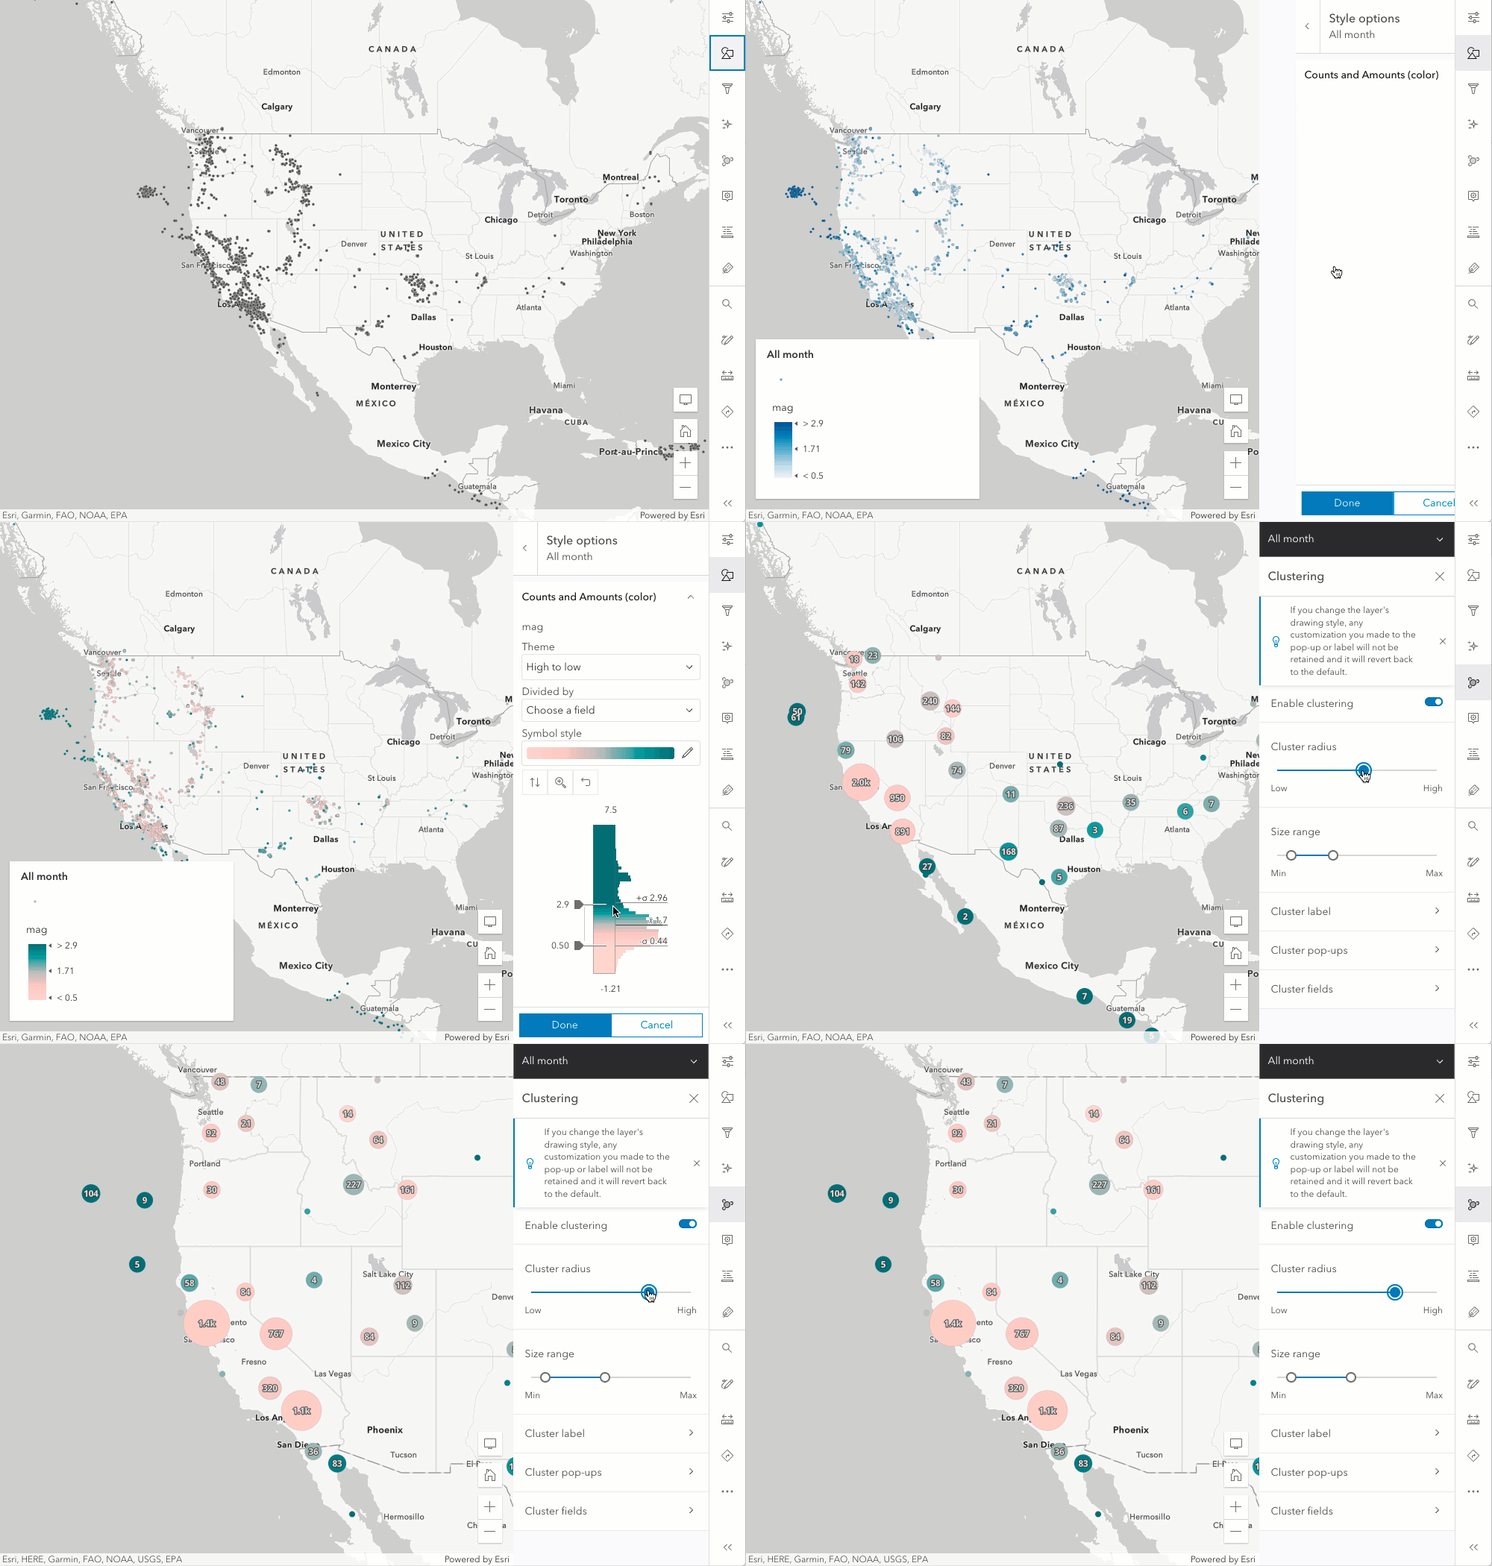
Thanks to the performance improvements for generating statistics within the browser for client-side data, mapping and exploring data from CSV and GeoJSON data sources will be fast and highly interactive.


How about; when (temp > 50) && (temp < 70), “Nice”,
can you use &&?
Yep! You can use && and any of the operators listed here.