On September 8, 2020 a human caused fire started on the north end of Ashland, Oregon. Driven by winds over 40 mph, it left a 9-mile-long path of destruction burning over 2,800 structures and killing 3 people in just a few hours. Major portions of the cities of Talent and Phoenix were destroyed and thousands of people lost their homes and businesses.
As a former resident of Talent, I watched with sadness as the news of the fire broke. Over the course of the next week I made a series of maps to understand what happened and to describe the fire in a landscape context for those unfamiliar with the region.
In this blog I share the approach that I used to create these maps following the modern pattern of web GIS with readily available resources from ArcGIS Living Atlas. With a little knowledge you to can make simple but useful maps like these in minutes.
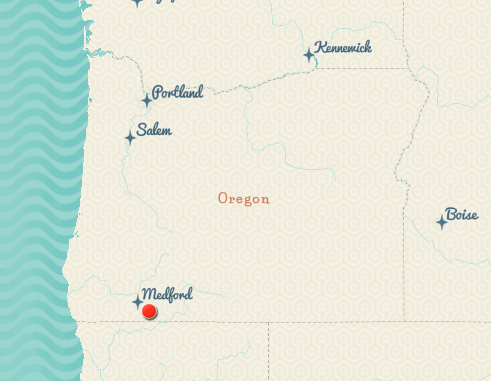
Location of the Almeda Drive Fire in southern Oregon indicated by the red dot.
This map was made in ArcGIS Online using the Mid-Century basemap and the dot was added as a map note. A small-scale locator map like this that won’t be used for analysis doesn’t need a lot of geographic precision so the map note is a quick and easy way to add the fire’s location to a map.
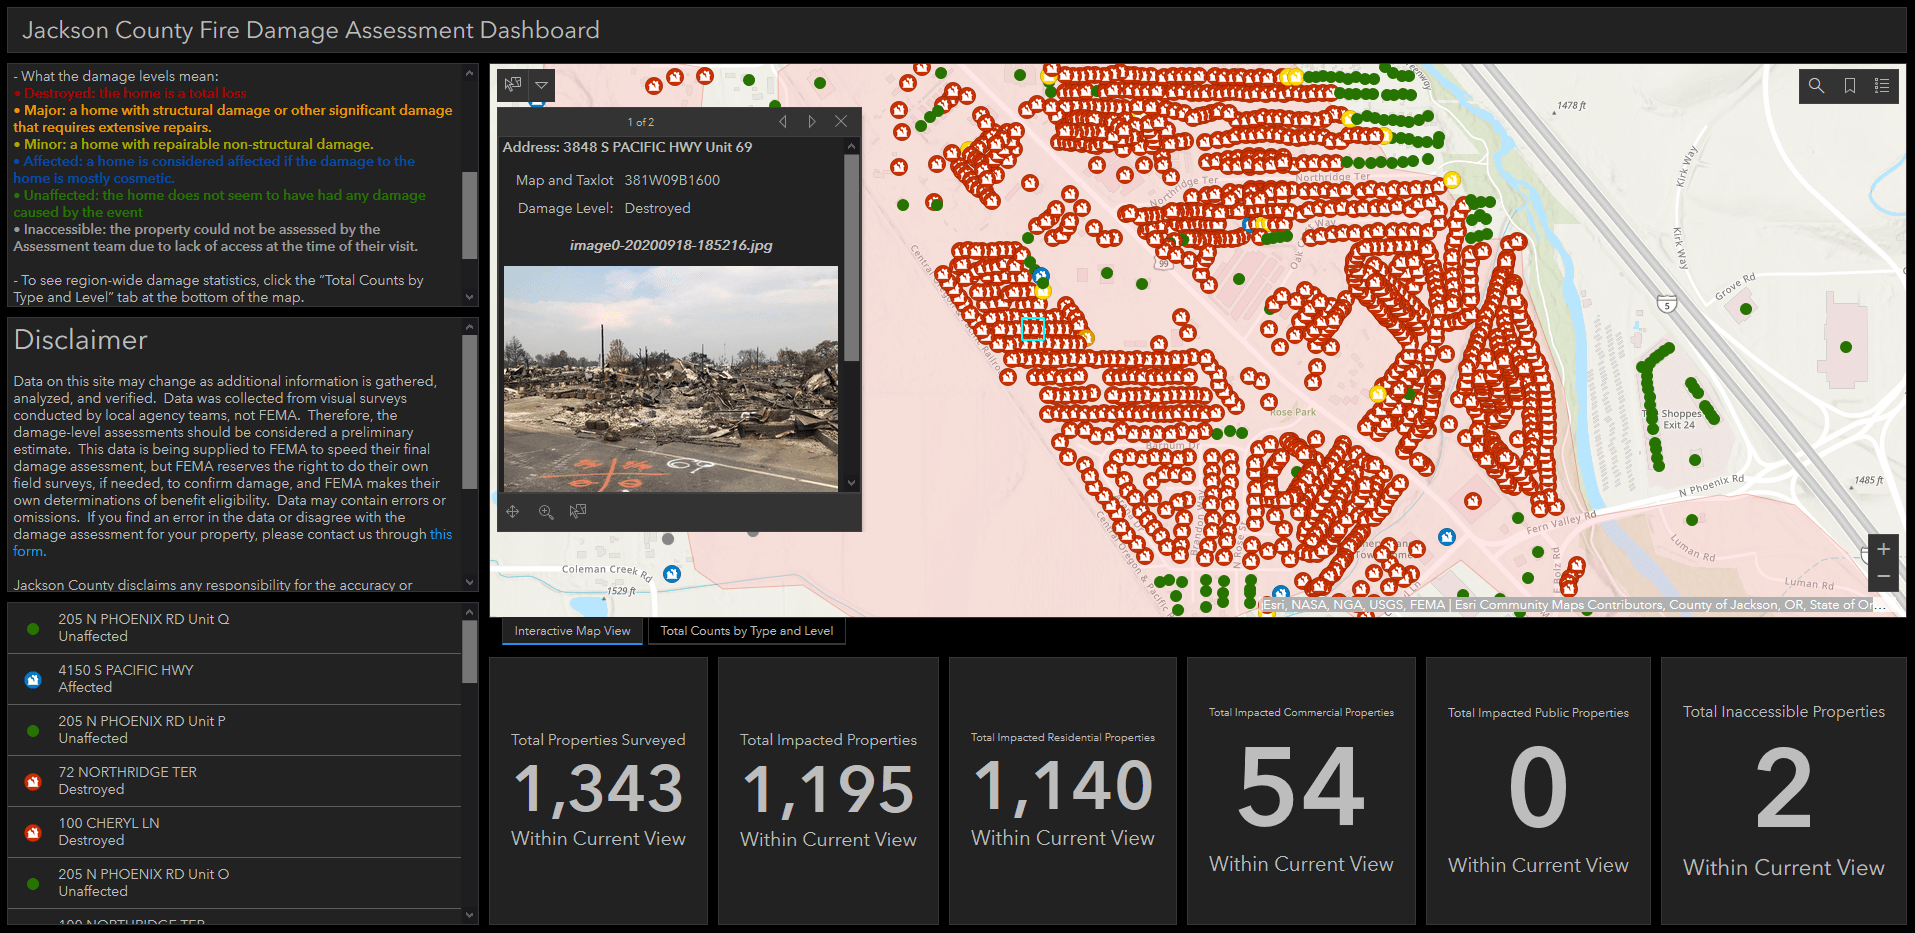
Jackson County’s Damage Assessment Dashboard documents the extensive damage. Red symbols indicate buildings, mostly homes, that are a total loss.
The Rogue Valley
Interstate 5 crosses north out of California, over Siskiyou Summit, and descends into the southern end of the Rogue River Valley. Three small communities lie along the highway: Ashland in the south, home of Southern Oregon University is known for its Shakespeare Festival; Talent, with a pre-fire population of 6,000 tucked in the pear orchards; and Phoenix to the north, is the last small town before arriving in the big city of Medford and home to many working families and a large community of retirees.
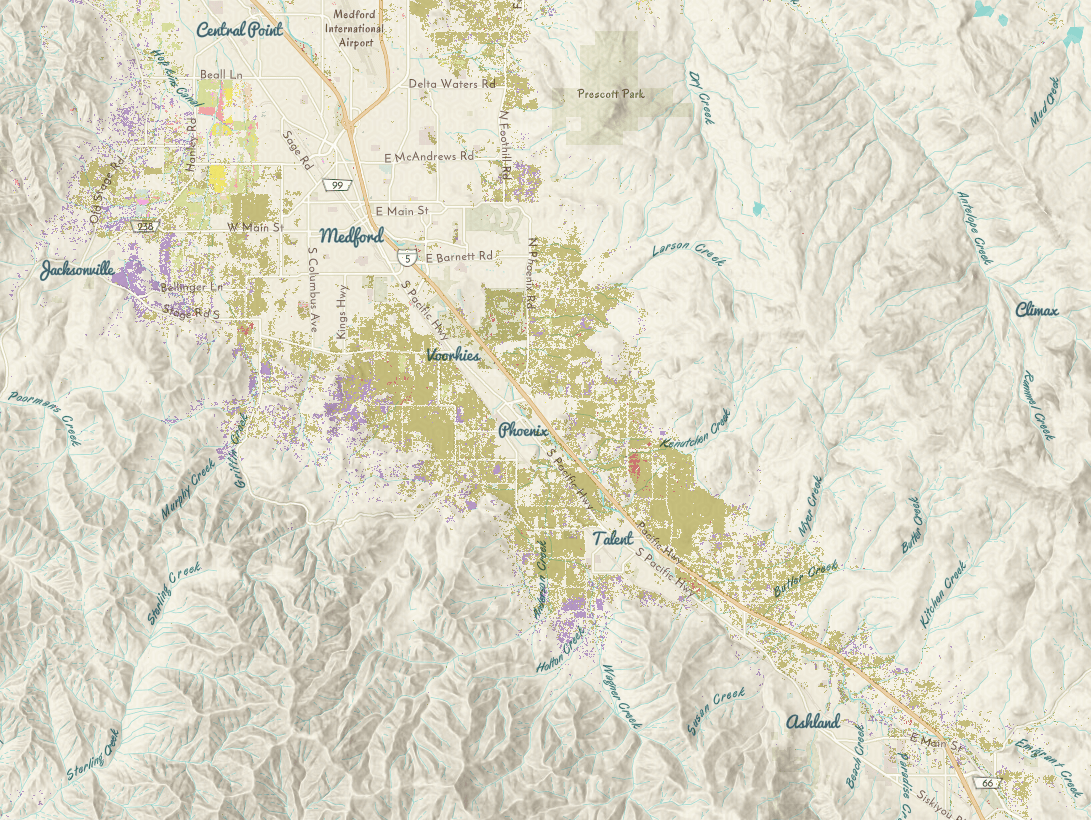
The southern Rogue Valley is known for Pears (in green) and wine grapes (in purple). The area’s scenic beauty and proximity to large urban centers make it a popular destination for tourists.
This map was created in the new Map Viewer Beta using the USA Cropland layer and the Mid-Century basemap. I added the World Hillshade layer to the basemap to show the terrain and set the blending properties of the cropland layer and the hillshade layer to multiply. For more information on using blending in the Map Viewer Beta to create maps like these see this blog.
The Landscape
To help understand the landscape context of the fire I created a 3d map in ArcGIS Pro using the USA Land Cover layer to show the location of developed areas and forest lands. This map is available as a web scene.
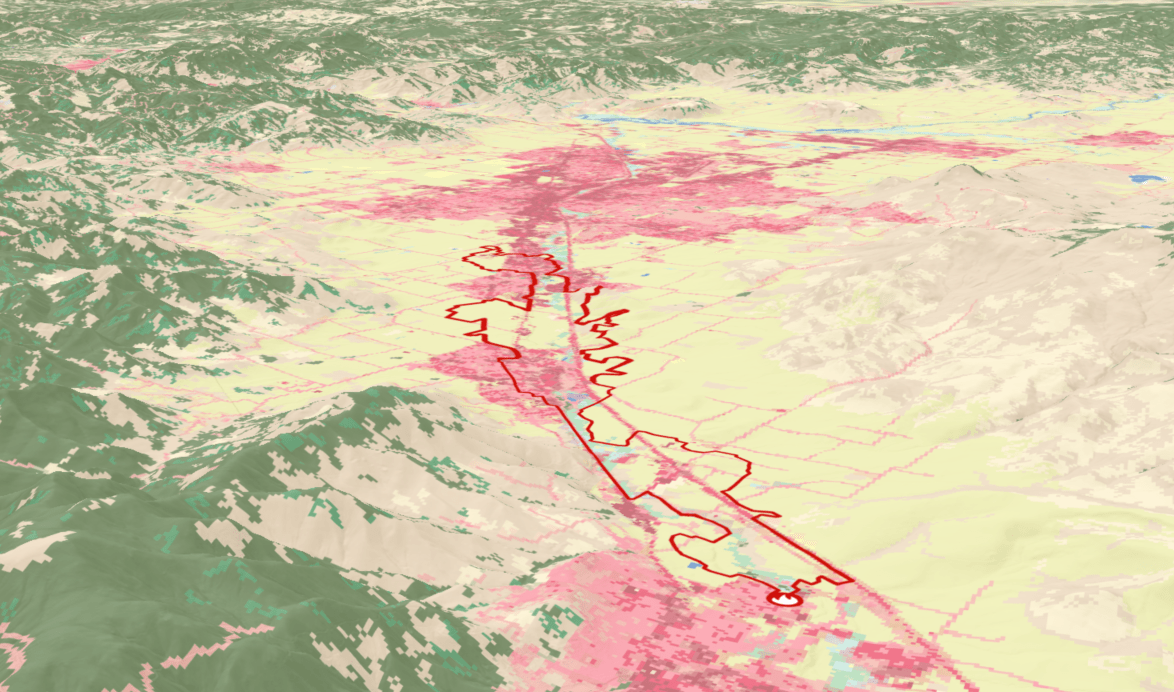
Three-dimensional view of the Almeda Drive Fire looking to the northwest with the fire’s origin point near the bottom of the view.
Layers from ArcGIS Living Atlas work across the platform. In this map I used the Living Atlas layer USA Current Wildfires for the fire’s origin and perimeter. The USA Land Cover layer shows developed areas in pink to red shades with Ashland in the foreground. Moving up the map we can see Talent and Phoenix impacted by the fire with the large urban area of Medford just north of the fire perimeter outlined in red. Interstate 5 can be seen as a straight red stripe up the east side of the fire. The surrounding mountains are green indicating forested areas. In this map you can see how the fire was blown almost straight down the valley by the wind.
The Fire Moved Quickly
NASA’s Visible Infrared Imaging Radiometer Suite (VIIRS) Active Fire layer provides a near real-time view of thermal hot spots at a 375m resolution. A live feed of the data is available through ArcGIS Living Atlas here.
While VIIRS typically collects several views of mid latitudes per day, the fire burned so quickly that we only get three snapshots as the fire burned. The fire started a little after 11:00am on Tuesday September 8, 2020 and hot, dry winds immediately began to push the fire northwest.
The first VIIRS pass over the fire was at 1:24 pm local time. From the map below we can see that in a little over 2 hours the fire spread over five miles downwind to the south end of Talent. The next look at the fire was at 3:06 pm. At this point 4 hours after ignition, the fire is burning in Phoenix nearly 9 miles to the northwest of the origin. Early the next morning we get one last look at 3:24am where you can see that the fire is no longer showing hot spots on the south end and the north end has cooled as indicated by the smaller symbols.
By the time of the next satellite pass no hot spots remain that can be detected by this sensor. Given the rapid rate of spread it is fortunate that more people were not hurt.
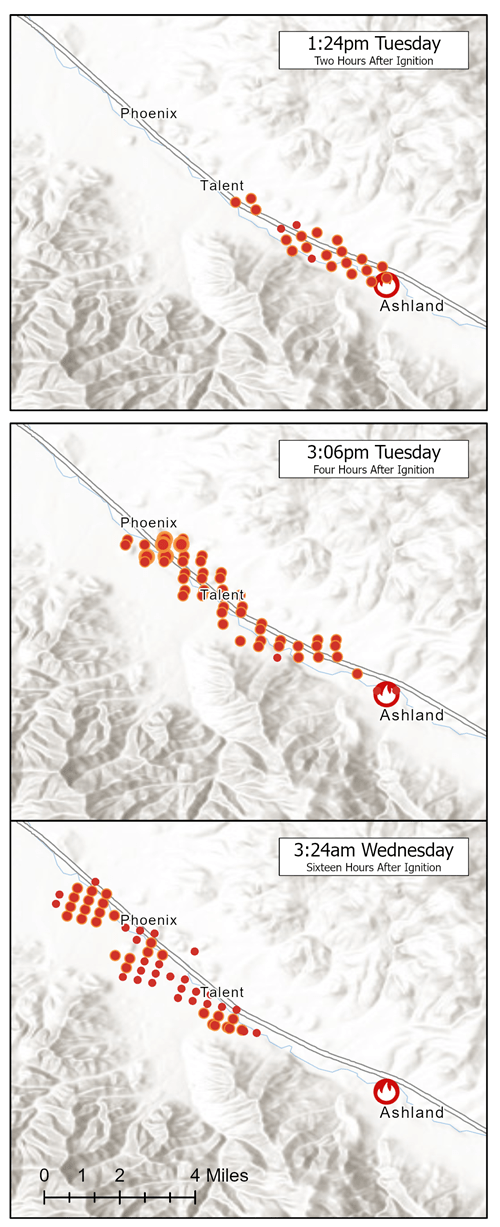
Progression of the Almeda Drive Fire September 8-9, 2020. Map created in ArcGIS Pro using the Terrain with Labels basemap.
Land Management
In the western United States, issues of fire and forest management in a changing climate, especially as they relate to federal forest management, have generated controversy for decades. In southern Oregon where federal agencies including the US Forest Service, Bureau of Land Management, National Park Service, and US Fish and Wildlife Service manage significant portions of the landscape questions of ownership and management often arise when talking about fire.
I used the USA Protected Areas – Fee Managers layer and the Terrain with Labels basemap to show land ownership in the fire area. Simple maps like this take less than a minute to produce and are built entirely with Living Atlas resources.
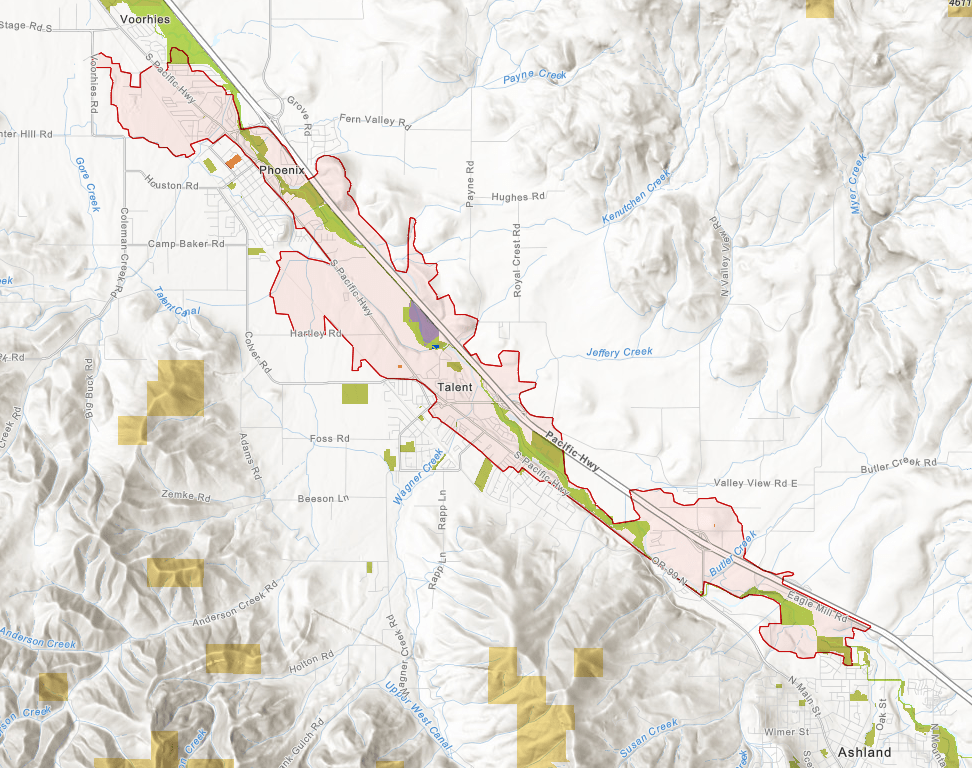
This map shows governmental lands with the Almeda Drive Fire perimeter. This fire primarily burned private lands (no color) with some city and county park lands in green. The rest area on Interstate 5 in purple appears to be the only federal land impacted. Some areas of Bureau of Land Management Lands (yellow) are in the hills surrounding the fire.
Who was affected?
The American Community Survey created by the US Census provides information about the number of people living in poverty and many other useful demographic and economic attributes. I made the map below using the ACS Poverty Status Variables – Boundaries layer and the Terrain with Labels basemap.
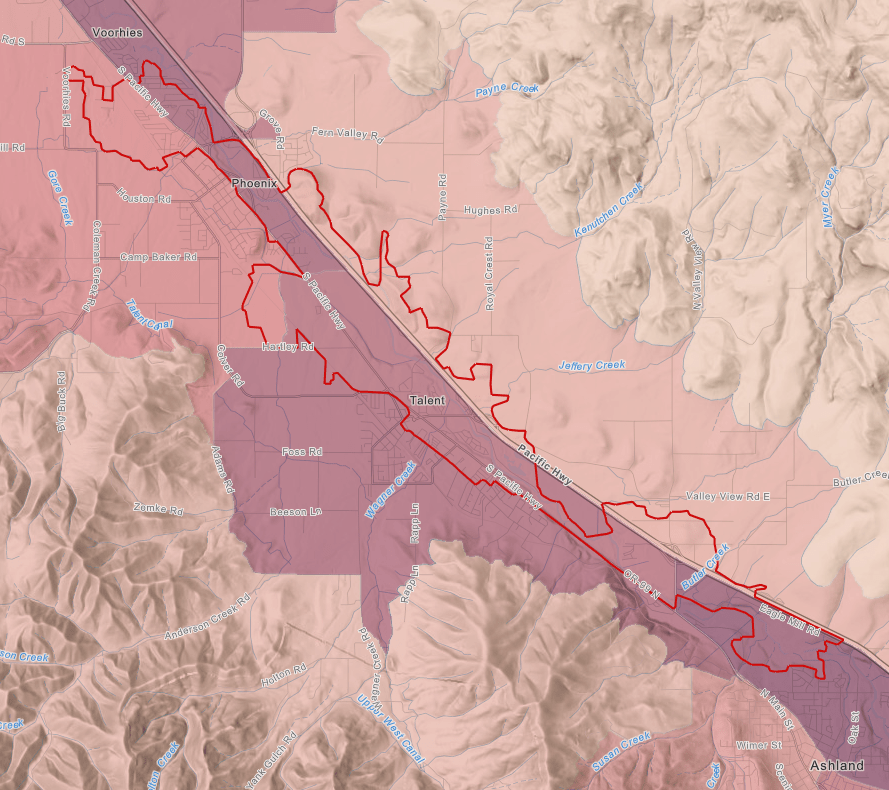
Nearly 20% of the population in the fire area lives in poverty. The American Community Survey provides an estimate of poverty rates by census tract. In this map tracts with darker purple color have higher rates of poverty.
Several large mobile home parks and apartment complexes burned along with many small businesses. The area is popular with retirees and is home to the hardworking people who are the foundation of the regional tourism industry and provide the labor needed in the pear orchards and vineyards. Housing in the region is limited and the massive loss of lower-cost housing will have a huge impact on working people.
There are many more maps you could make about an event like this using the ArcGIS Living Atlas. Having ready-to-use layers at your finger tips enables you to rapidly create knowledge and understanding through mapping. This modern pattern of web GIS provides a powerful way to understand, create and share.
Local governments and non-profits are coordinating the fire recovery through the Rogue Valley Preparedness and Recovery Hub.
The region has been hit hard by the loss of tourism due to the COVID pandemic and the fire is a terrible blow but the community will rebuild so if you ever find yourself passing through southern Oregon consider stopping in for a taco in Phoenix, enjoy the library and parks in Talent, or to see a play in Ashland.
Photograph of downtown Talent by the City of Talent

Rich, if my hunch is correct, you are the Rich Nauman with PNW wildlife roots. I heard you were working for ESRI. Thanks for this thorough and interesting article. It will take a while to study! I live in the Rogue Valley now so this was close to home.
Hi John, Yes you guessed correctly. Send me an email sometime (rnauman@esri.com). It would be fun to catch up and get your take on the fire.