Choropleth maps are filled areas of color representing quantitative data. Normalization is an important step in making choropleth maps. The goal of normalization is to allow for meaningful comparisons across features.
How do you know if you need to normalize your data? How should you normalize it? How can you tell if normalization is working? What is the point? These short videos share advice, examples, and analogies to help answer these questions and explain normalization for choropleth maps.
Video #1. Choropleth maps versus graduated symbols
First, you need to decide if a choropleth is really the best way to map your data. The general rule to follow is that raw values should be mapped with graduated or proportional symbols, and derived values should be mapped with color.
The data shown in this video is derived from Street Lights and Census 2021 Dissemination Areas from Halifax Open Data.
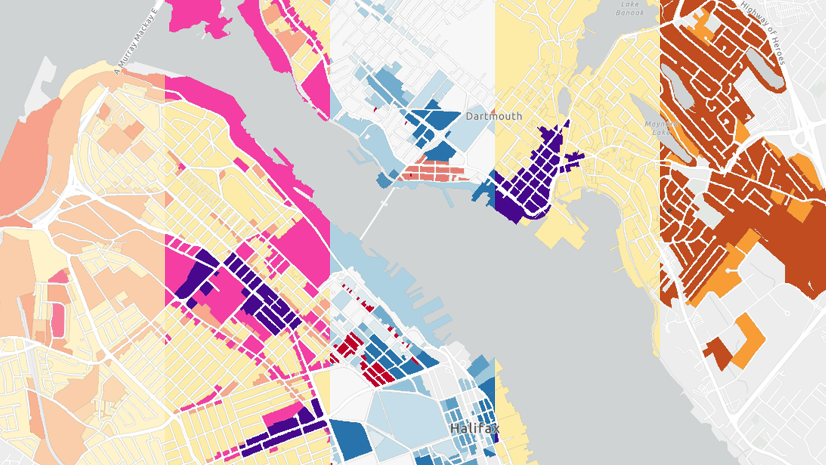
Video #2. Why do you need to normalize choropleth maps?
You can turn raw values into derived values by normalizing them. Probably the most common way to normalize data for choropleth maps is to divide by area.
The data used in this video is Census 2021 Dissemination Areas and Buildings from Halifax Open Data, and North America Hexbins 10km: Sahr K, White D, Kimerling AJ. 2003. Geodesic discrete global grid systems. Cartography and Geographic Information Science 30(2):121-134.
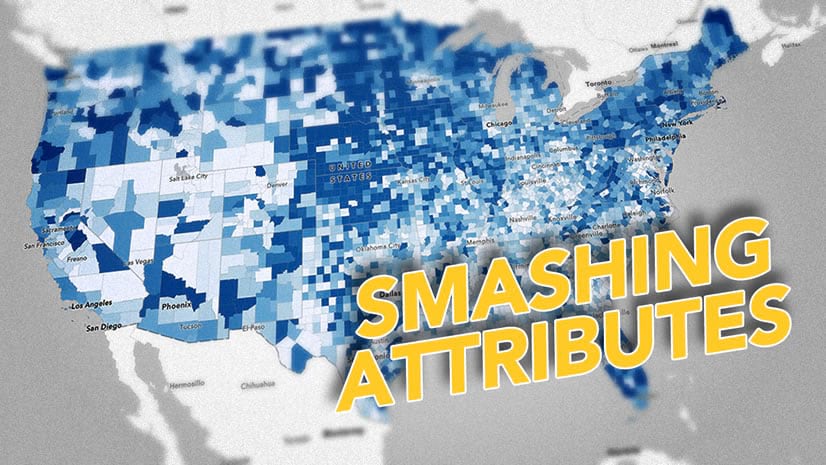
Video #3. Does your map allow for meaningful comparisons?
This is the heart of the matter—the purpose of normalization. Take some time to assess your map and ensure it’s achieving this goal.
The following data is featured in this video:
- Bureau of Labor Statistics Monthly Unemployment (latest 14 months), U.S. Bureau of Labor Statistics (BLS), Local Area Unemployment Statistics (LAUS)
- USA Census Counties, Esri; U.S. Department of Commerce, Census Bureau; U.S. Department of Commerce (DOC), National Oceanic and Atmospheric Administration (NOAA), National Ocean Service (NOS), National Geodetic Survey (NGS)
- ACS Median Household Income Variables – Boundaries, U.S. Census Bureau’s American Community Survey (ACS) 2019-2023 5-year estimates, Table(s) B19013B, B19013C, B19013D, B19013E, B19013F, B19013G, B19013H, B19013I, B19049, B19053
- ACS Housing Units by Year Built Variables – Boundaries, U.S. Census Bureau’s American Community Survey (ACS) 2019-2023 5-year estimates, Table(s) B25034, B25036, B25035, B25037
There are exceptions to all cartographic rules, even this one. There are times when the data doesn’t align with the raw-versus-derived dichotomy, or where other considerations are more important than this one. But that’s why it’s important to understand the rule beyond rote memorization. If you understand the purpose of a rule or convention, you’ll know when you can break it, and why.


Article Discussion: