As we begin this topic, we need to understand how this will impact GIS software users, and specifically how this technology can be used with ArcGIS Pro. This understanding will ultimately focus on several areas:
- What is a Multi-session VM?
- What is Azure Virtual Desktop?
- How will it perform?
We will get to these questions and understand what kind of performance we can expect when we run tests using the ArcGIS Pro Performance Assessment Tool (PAT) against this environment. For the purposes of this blog, I will not dive into the setup process and what it takes to configure the infrastructure for AVD. Various tutorials are available online that can assist with the setup. This blog will focus on the virtual technology in use, additionally the performance aspects of running ArcGIS Pro leveraging Multi-session VMs with Azure Virtual Desktop (AVD).
What is a Multi-session VM? This is exactly as it sounds. One VM or OS instance that can support multiple simultaneous user connections. This is not an uncommon scenario as many have used Windows server products in the past doing something similar. In this case windows 10 is an option provided by Azure to do what previously was only available with the Windows Server Operating Systems. This allows a Windows 10 desktop operating system to grant access to many simultaneous connections. The use of a single operating system to support an application such as ArcGIS Pro can be a bit tricky. Because of the architecture of the application, it can use up all the available resources quite easily. I will address the performance considerations as we go on.
What is Azure Virtual Desktop? Azure has had Esri recommended solutions for several years. What you get with the Azure Virtual Desktop is a desktop and app virtualization service that runs in the Azure cloud. The functionality is comparable to other virtualization products, and in many ways will seem very similar in how it is managed. It is worth noting that currently Esri does not recommend using app virtualization to support ArcGIS Pro users. We still recommend Desktop virtualization.
Let’s talk about performance. To figure out what would work and how, this test focuses on using the NCas T4 v3-series of VMs perform tests. I am going to focus this on two variants the NC4as, and the NC16as. The NC4as is newer but a well-known commodity now. This VM type is comparable to other cloud hosted options that provide a good user experience, especially when setup for a 1 to 1 usage. So that brings the question, does it work with AVD and for more than one user at a time?
Configuration of the VM involved the basic deployment of the Azure VM with the Windows 10 Multi-session option, the installation of the GPU driver, ArcGIS Pro 2.9, and PAT testing suite. To capture performance data, I used GPUProfiler. The process of testing is to run PAT on each session simultaneously. For a quick background on PAT, it will run a series of tests that will test the hardware while performing tasks with ArcGIS Pro that include 2d, 3d, as well as test other GP tools including running ArcPy.
Establishing a Baseline, the tests will run with 1 session on the NC4as, using AVD as a connection broker. To understand the results, we see a sine wave representing performance metrics from the CPU, GPU, and RAM usage. Below are the single session results viewed from the GPUProfiler chart.
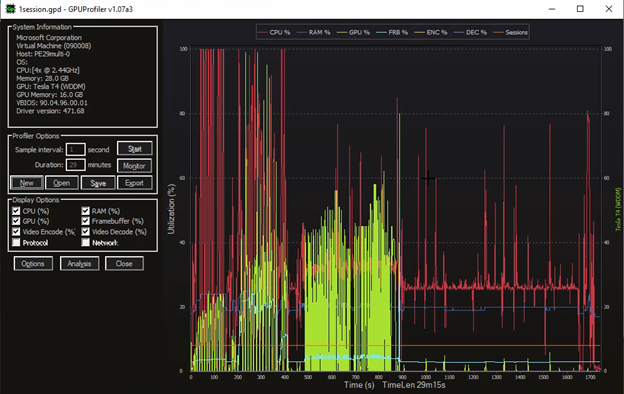
What we see is a high initial use of CPU% (Red line) as the 2d part of the test kicks off. PAT continues to run, and we see how the performance of the hardware is handling the test. It is quite normal to see bursts of usage that can hit 100%. Ideally, we want to see peaks and valleys without a sustained period pegged at 100%. PAT is testing several components of our software including 3d. The 3d part is best observed in the graph between the 200 to 400 seconds and following the GPU% (yellow green) sine wave. Moving beyond the 500 second mark, PAT is running ArcPy tests, some of which are CUDA enabled tools that will test the GPU as well as the CPU through out the remainder of the test.
Compare the single session results above with the 2 sessions results below:
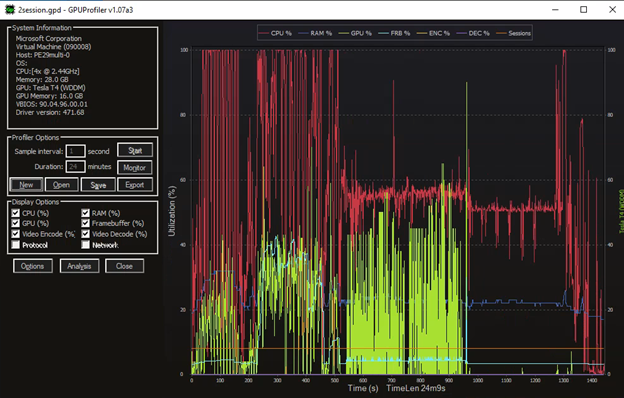
What we see now is that the CPU is peaked and sustains a higher usage throughout the test. It is worth noting that both sessions were successful and completed the tests in the given time of less than 30 minutes. Neither session sustained a failed or incomplete test caused by a timeout or unavailable resources.
Below are the 3-session test results:
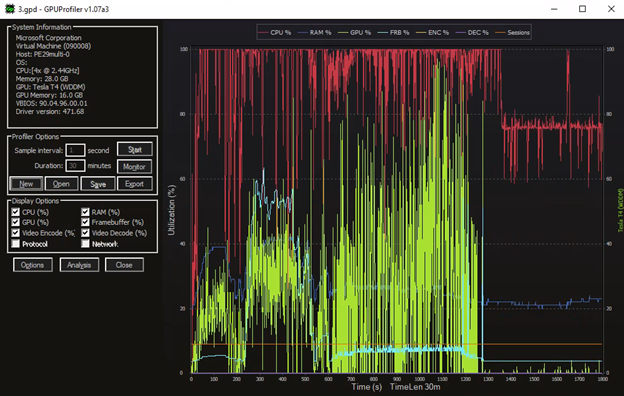
The 3-session test was considered a failed test. The test was unable to complete in the given time but was also unable to complete the tests as one of the sessions timed out due to unavailable resources, specifically the CPU. To understand this failure better I reran the test. While running I attempted to interact with the desktop of one of the test sessions. I opened menus and interacted with the ribbon in ArcGIS Pro. This was a bit challenging as mouse interaction was delayed, which was less than conducive to the user experience. What did we learn so far then, 2 sessions with this NC4as configuration worked, however once we moved to 3 sessions the user experience was suffering due to a lack of resources, so two sessions would be all that would be suggested with this VM type.
So, let’s move to the next mentioned VM type, the NC16as. Skipping the results prior, we jump right into the results from the 4-session test.
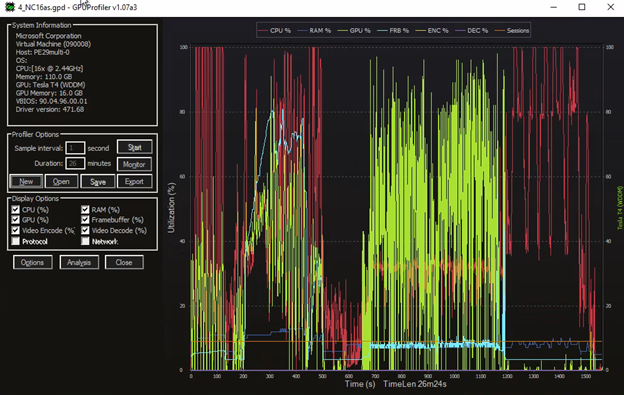
The NC16as VM type has 16 CPUs versus 4 on the NC4as. Recall the prior NC4as began to struggle with a lack of CPU resources beyond 2 running sessions. CPU usage in this case is higher, it also has a higher distribution of GPU usage during the test. This is a good overall use of the hardware which is maximizing its allocation with the 4 simultaneous sessions running PAT.
View the 5, 6 and 7 session runs below, each was successful in completing the tests.
With each of these tests we see a very nearly maximized usage. It is worth noting that the 7-session required multiple runs to complete a successful run. The 7-session ran into time outs during the test run, this was just like the NC4as with 3 sessions. Although it was able to complete the test during a later run, it also was fully using the hardware. The high CPU and GPU usage impacted the test run, additionally impacted the user experience as the user interaction was delayed. 8-sessions were also tested but it was unable to pass.
So, what does this all mean? What we have with Azure is a new option, but the option has limitations. CPU and GPU resources need to be very carefully looked at when planning to use AVD. During testing just watching the graphs we can see how hard the software is pushing the Azure VM as the sessions added up. In the case of this test, I had hoped to maintain at least a 2 CPU to each session ratio, however I was not able to fully hit that target. This means that simple math and predictions will not fully account for all the needs to deliver the ideal user experience. What this means is that sessions per VM is key, but also plan for usage and set expectations. With the tested VM types I would not suggest running more than 6 sessions when using the NC16as T4. I would suggest that 5 is the ideal user sessions number for this. At this level performance was predictable and the VM was not fully saturated making for the best overall user experience with this VM type. These testing results are based on using PAT to test various abilities of our software, but individual results could vary and its very important to keep that in mind. Using AVD is a solid option to deliver ArcGIS Pro to several users on a single VM, this can provide the added benefit to help control cloud costs. When used properly and with a solid cloud use strategy you can deliver ArcGIS Pro to more users leveraging Azure Virtual Desktop.


Hi Ryan. This is a very helpful article, thank you! Can you expand on this statement?: “Esri does not recommend using app virtualization to support ArcGIS Pro users”. By this, do you mean remote applications that have been published as remote apps in AVD? If yes, can you point me to some documentation on this? We were hoping to do exactly that, but will reconsider if Esri has found this to be an issue.
I need to write and update/addendum to this with some guidelines. I will be presenting on this during UC 2023 and will be addressing this content during that time as well. It really comes down to understanding the constraints of the implementation and what AVD does. At the time when I wrote this we avoided this part a bit but its a broader issue. If it is something that you need assistance with we can schedule a 30 minute call to help as I get that update written.
Good to know! I will definitely take you up on that call.